
The British pound is trading at pivotal levels across major currency pairs, with GBP/USD stalling near 1.36, GBP/JPY consolidating above 200, GBP/CAD reversing from resistance, and GBP/AUD under sustained pressure. With volatility likely to rise around upcoming economic data, traders are watching closely for breakouts or reversals across sterling markets.
View related analysis:
- EUR/USD, USD/JPY, VIX, Gold, Crude oil: COT Report Analysis
- GBP/USD, EUR/GBP: COT Data Appears Favourable to British Pound Bulls
- GBP/USD Outlook: BOE Rate Cut Odds Fade as UK Inflation Stays Hot
- USD, GBP/USD, VIX, WTI Crude Oil: Commitment of Traders (COT) Analysis
- USD/JPY, GBP/JPY Outlook: Trump Eyes Fed Shakeup, BOE Rattle Pound Bears
British Pound Technical Setups Across Majors
GBP/USD Technical Analysis: British Pound vs US Dollar
An unorthodox inverted head and shoulders pattern is forming on the GBP/USD daily chart, though its structure raises doubts unless the British pound breaks higher against the US dollar with conviction.
The failure to achieve a solid daily close above 1.36 highlights hesitancy from GBP/USD bulls ahead of the FOMC meeting. The so-called “right shoulder” looks more like an ABC correction than a classic trough, and ideally it would sit higher than the left shoulder during an uptrend.
On the GBP/USD 1-hour chart, the trend remains bullish. A lower high has formed, suggesting the pair could dip towards the 50-bar EMA or the high-volume node (HVN) at 1.3577 before resuming higher. A confirmed break above 1.36 would likely see the British pound extend gains towards the 2022 high near 1.3749, keeping the bias bullish while prices hold above the HVN.
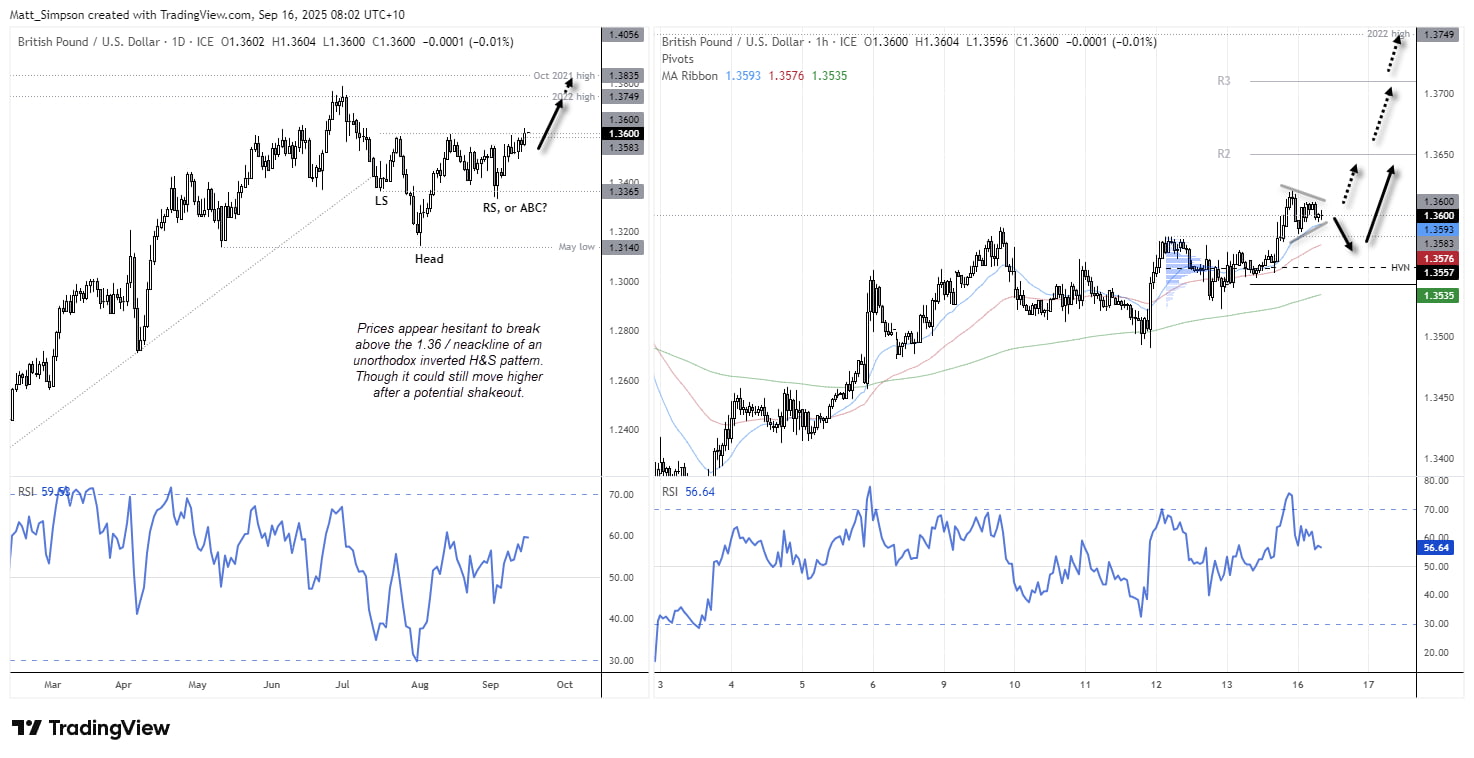
Chart analysis by Matt Simpson - data source: TradingView GBP/USD

GBP/JPY Technical Analysis: British Pound vs Japanese Yen
GBP/JPY finally managed a daily close above the 200 level, though only just. This psychological barrier is a significant hurdle for pound bulls, and while it signals potential for further upside, gains may be capped below 201 in the near term.
The sharp four-day rise could prove to be a sucker punch for bulls unless momentum accelerates further. With the daily RSI (2) now overbought, GBP/JPY may be vulnerable to one last push higher before a corrective pullback below 200.
On the 1-hour chart, prices are consolidating above the 20-bar EMA with a sequence of higher lows. Pound bulls may look to buy dips within Friday’s range for a move towards the weekly and monthly R1 pivots near 200.85, though downside risks remain should the pair slip beneath trend support.
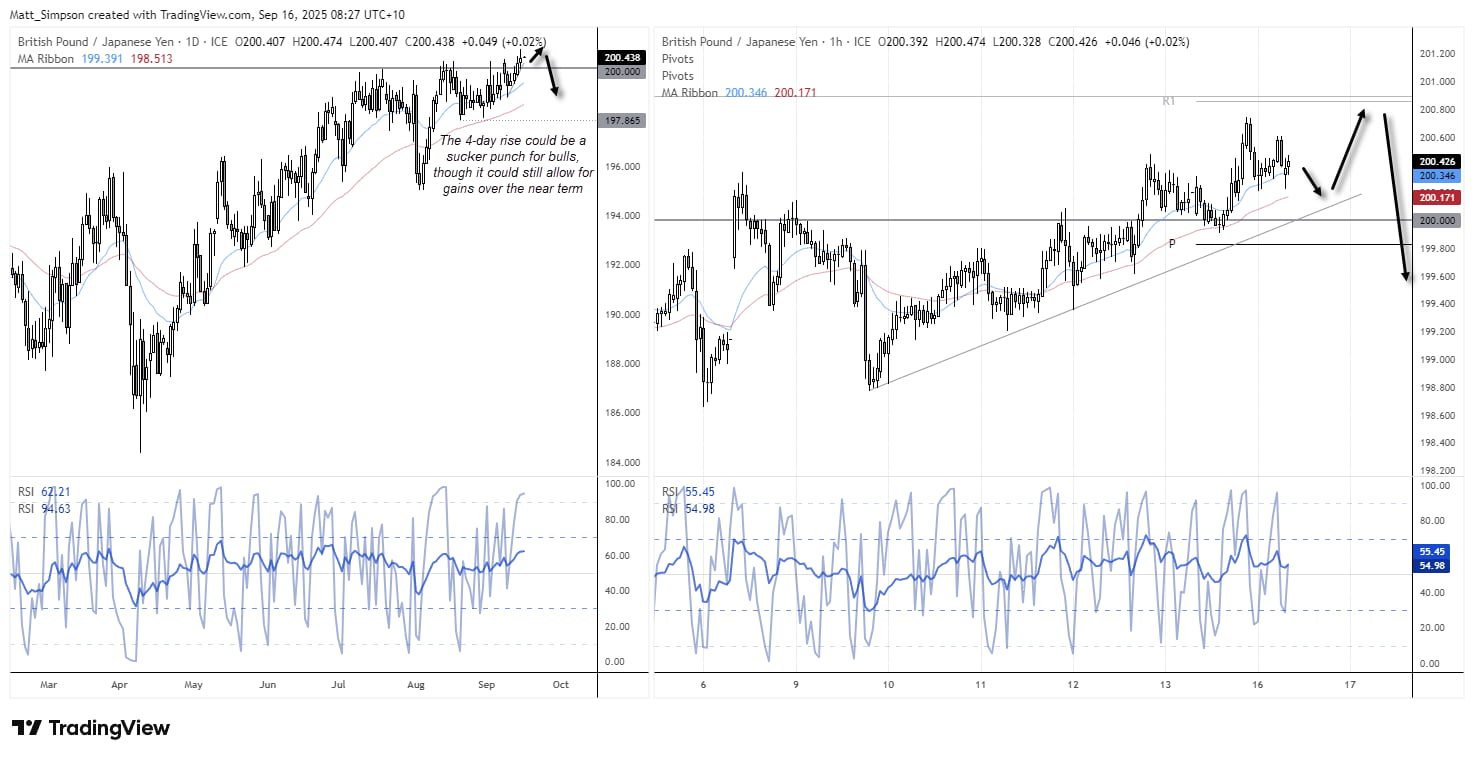
Chart analysis by Matt Simpson - data source: TradingView GBP/JPY

GBP/CAD Technical Analysis: British Pound vs Canadian Dollar
The British pound rallied for seven consecutive sessions against the Canadian dollar before Monday’s bearish engulfing candle halted the advance. Importantly, this reversal pattern formed at the June high and the monthly R1 pivot, strengthening the case for at least a minor top on the GBP/CAD daily chart.
On the 1-hour chart, support has emerged near the 200-bar EMA. A hammer candle formed alongside an extremely oversold 2-bar RSI, signalling that a short-term bounce could unfold. A break above the weekly pivot would confirm a rebound, but sellers may look to fade rallies back towards the monthly R1 pivot. The broader bias remains bearish on the GBP/CAD daily chart while prices hold beneath the June high.
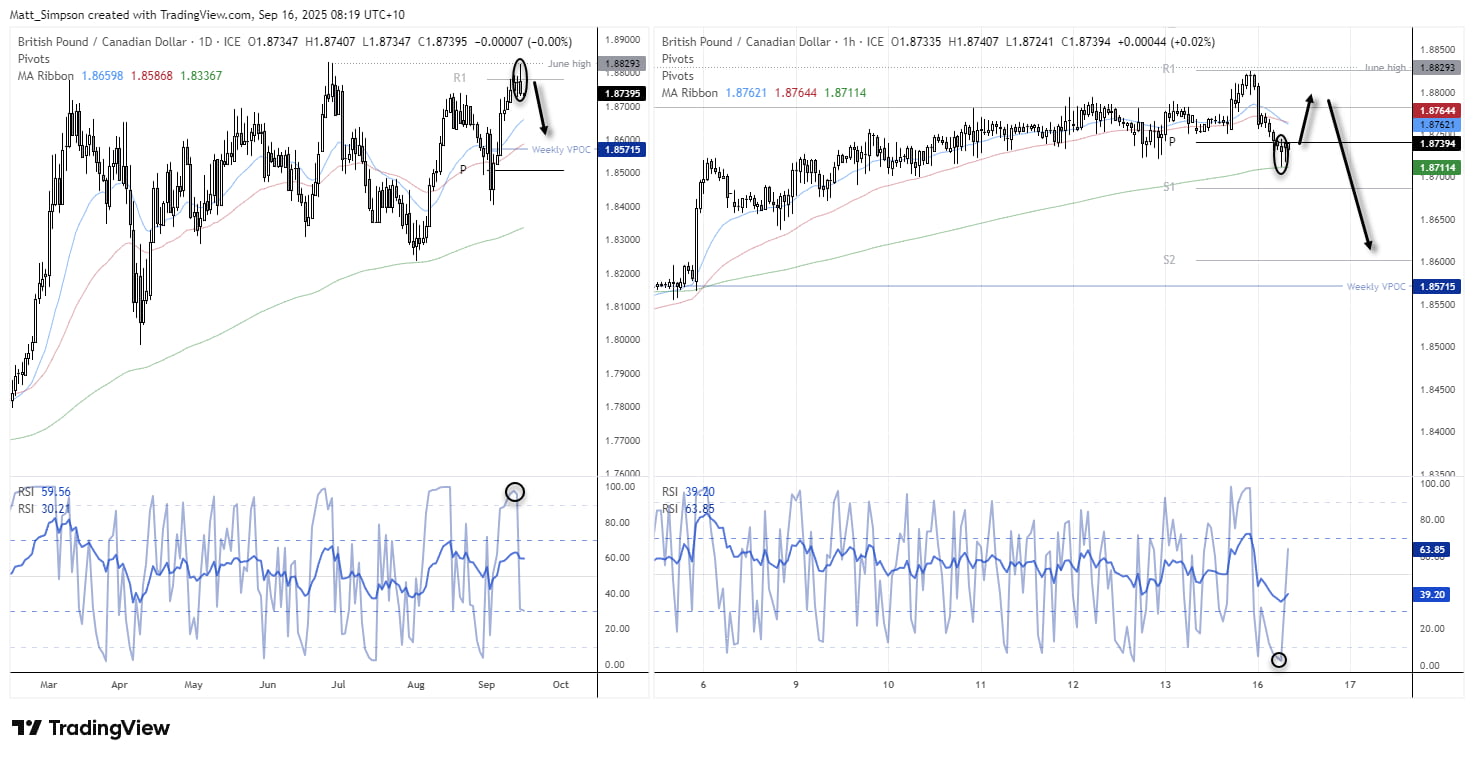
Chart analysis by Matt Simpson - data source: TradingView GBP/CAD
GBP/AUD Technical Analysis: British Pound vs Australian Dollar
Like the US dollar, the British pound has met its match against the Australian dollar, with GBP/AUD falling over 3% in the past 17 days – mostly in a straight line. The cross also shows the potential to extend this move lower towards the December high (2.032), a break beneath which brings the August high (2.0149) into focus.
Two dojis have appeared on the daily chart to show a loss of bearish momentum over the near term, and a bullish divergence has appeared on the daily RSI (2) within the overbought zone to warn of a potential move higher. However, with the 200-day SMA (2.0471) and 200-day EMA (2.0429) hovering nearby, perhaps the upside could be limited, and GBP/AUD bears may be lurking to fade into any apparent false breaks above them.
Also note a potential ABC correction on the 1-hour chart which may already have been completed, with a bearish outside candle near showing a loss of appetite from the bull clamp heading into the close.
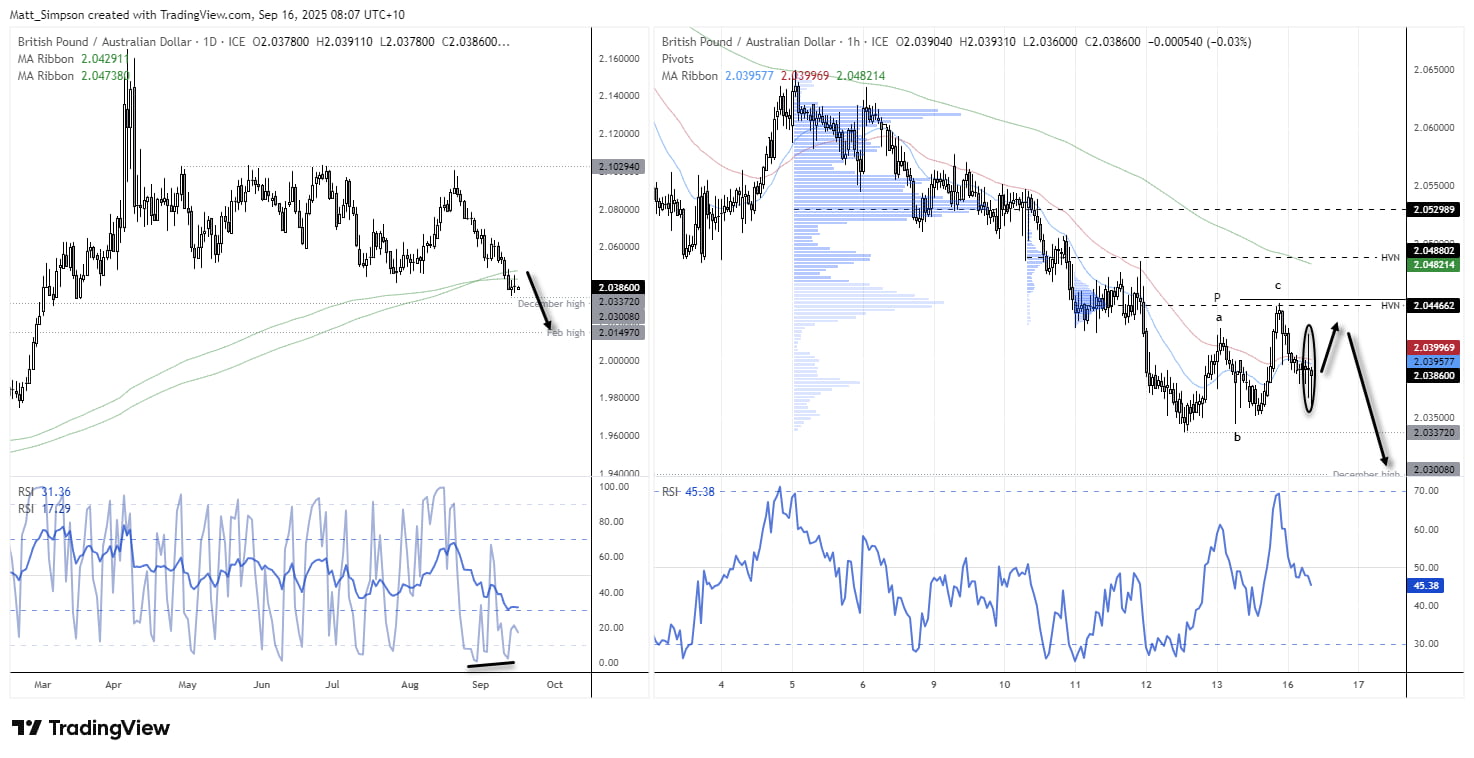
Chart analysis by Matt Simpson - data source: TradingView GBP/AUD
Key Economic Events for Traders (AEST / GMT+10)
08:45 NZD FPI (Aug), RBNZ Offshore Holdings (Aug) (NZD/USD, AUD/NZD, NZD/JPY)
14:30 JPY Tertiary Industry Activity Index (Jul) (USD/JPY, EUR/JPY, Nikkei 225)
16:00 GBP Average Earnings ex Bonus, Average Earnings Index +Bonus, Claimant Count Change, Employment Change 3M/3M, Unemployment Rate (Jul/Aug) (GBP/USD, EUR/GBP, FTSE 100)
18:30 HKD Unemployment Rate (Aug) (USD/HKD, HKD/JPY, Hang Seng)
19:00 EUR German ZEW Current Conditions, German ZEW Economic Sentiment, Wages, Industrial Production, Labor Cost Index, ZEW Economic Sentiment (Jul–Sep) (EUR/USD, EUR/GBP, DAX)
19:30 EUR German 5-Year Bobl Auction (EUR/USD, EUR/GBP, DAX)
20:00 CNY FDI (Aug) (USD/CNH, AUD/CNH, CNH/JPY)
22:00 EUR German Buba Vice President Buch Speaks (EUR/USD, EUR/GBP, DAX)
22:00 NZD GlobalDairyTrade Price Index, Milk Auctions (NZD/USD, AUD/NZD, NZD/JPY)
22:15 CAD Housing Starts (Aug) (USD/CAD, CAD/JPY, EUR/CAD)
22:30 USD Core Retail Sales, Export Price Index, Import Price Index, Retail Control, Retail Sales (Aug) (S&P 500, Nasdaq 100, USD/JPY)
22:30 CAD CPI, Core CPI, Common CPI, Median CPI, Trimmed CPI (Aug) (USD/CAD, CAD/JPY, EUR/CAD)
22:55 USD Redbook (S&P 500, Nasdaq 100, USD/JPY)
23:15 USD Capacity Utilization Rate, Industrial Production, Manufacturing Production (Aug) (S&P 500, Nasdaq 100, USD/JPY)
00:00 USD Business Inventories, NAHB Housing Market Index, Retail Inventories Ex Auto (Jul/Sep) (S&P 500, Nasdaq 100, USD/JPY)
02:30 USD Atlanta Fed GDPNow (Q3) (S&P 500, Nasdaq 100, USD/JPY)