
Weekly Market Positioning Overview – COT Report Highlights (24 June 2025)
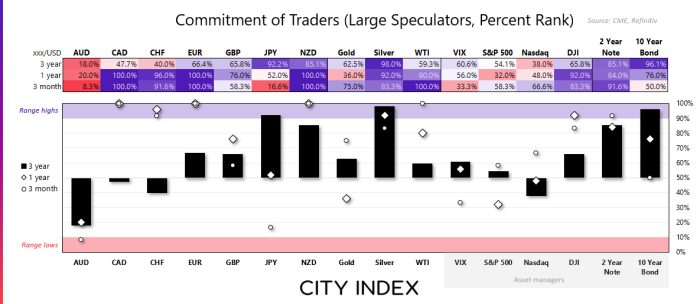
• US Dollar (USD): Traders were effectively net-short the US dollar by $21 billion last week (a 5-year high)
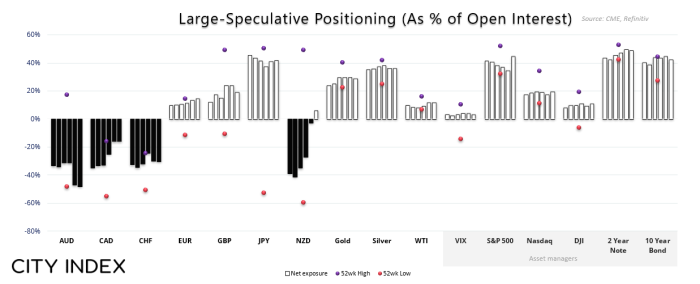
• European dollar (EUR): Large speculators increased net-long exposure by 9.6k contracts, with longs rising 1.3% (2.9k contracts) and shorts falling by -5.5% (-6.6k contracts)
• British pound (GBP): Net-long exposure declined by -8.5k contracts, with gross-longs falling -6.1% (-6.4k contracts) and shorts rising 3.2% (2k contracts)
• Japanese yen (JPY): Net-long exposure was effectively flat at 132.3k contracts long
• Australian dollar (AUD): Net-short exposure rose by 3.2k contracts, though gross-longs rise by -9% (2k contracts) and shorts increased by (5.8%) 5.2k contracts
• Canadian dollar (CAD): Gross-shorts fell by -17% (-16.1k contracts), making it the third consecutive week of short covering form CAD bears
• Swiss franc (CHF): Net-short exposure increased by ~10k contracts between large speculators and asset managers
• New Zealand dollar (NZD): Flipped to net-long exposure for the first time since October and to an 11-month high, with gross-longs rising 27% (4k contracts)
• Gold (GC): Net-log exposure fell by -5.4k contracts, with gross-shorts rising by 4.2% (1.6k contracts)
• Silver (SI): Net-long exposure by down by -4.3k contracts, though speculative volumes were lower with longs falling -5.1% and shorts down -1.3%
• Crude Oil (WTI): Managed funds actually reduced their net-long exposure to crude oil by -.1k contracts last week, ahead of the large selloff
View the full economic calendar
-- Written by Matt Simpson
Follow Matt on Twitter @cLeverEdge
How to trade with City Index
You can trade with City Index by following these four easy steps:
- Open an account, or log in if you’re already a customer
• Open an account in the UK
• Open an account in Australia
• Open an account in Singapore
- Search for the market you want to trade in our award-winning platform
- Choose your position and size, and your stop and limit levels
- Place the trade