


As 2025 comes to an end, one of the most important lessons for the oil market is that the balance between supply and demand expectations continues to dominate the main oscillations in crude prices. Oil is on track to end the year with WTI below 60 dollars, levels not consistently seen since 2021. Much of this decline stems from global supply changes that unfolded throughout the year. If this same dynamic persists, it could become a key factor to monitor in crude oil movements heading into 2026.

Events That Drove the Main Market Movements in 2025
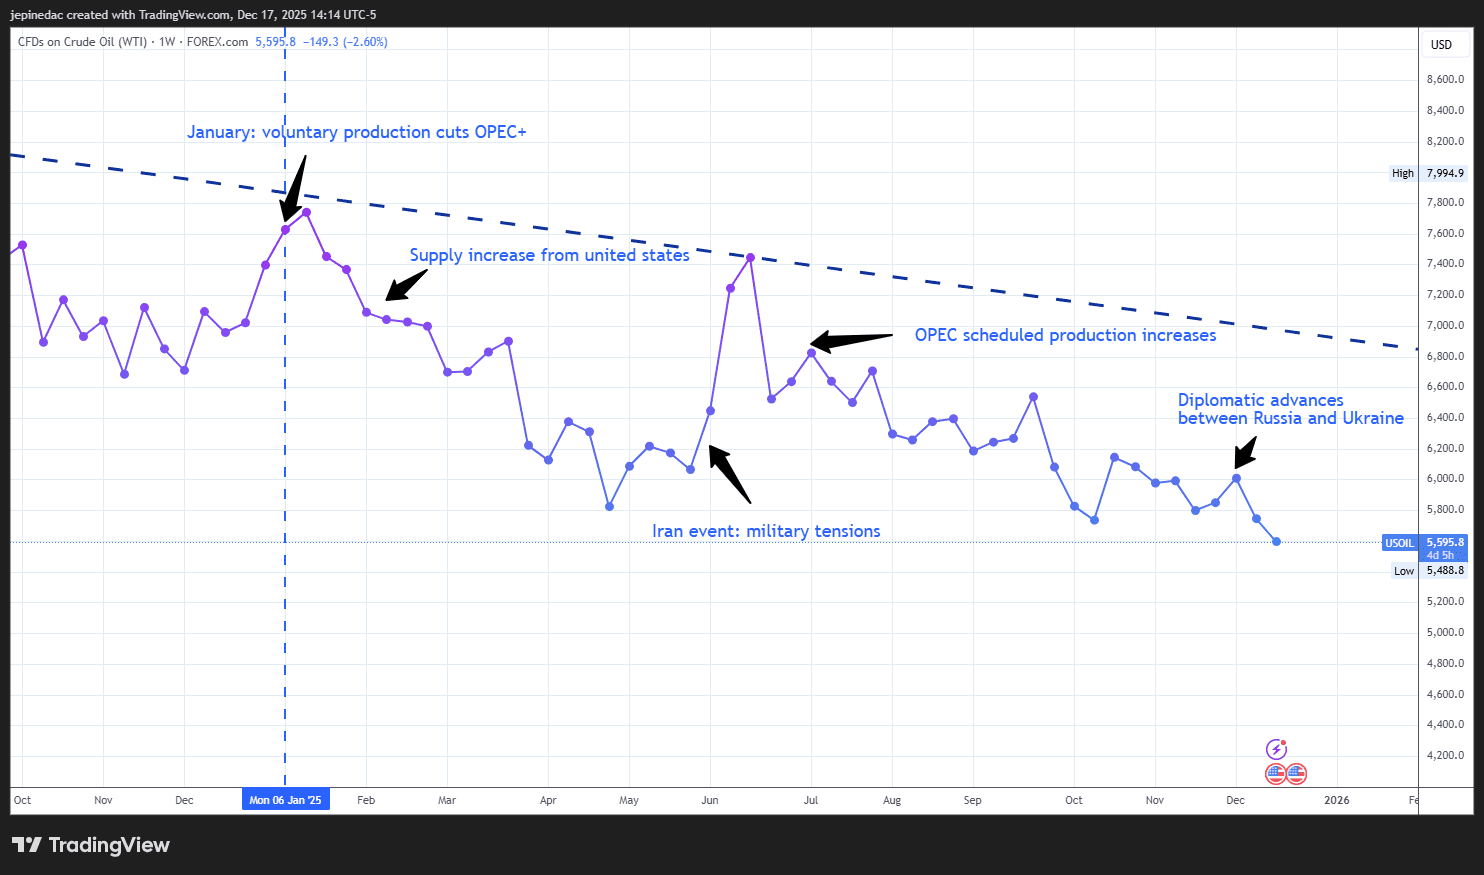
Source: StoneX, Tradingview
- The year began on a positive note for WTI as OPEC+ countries, including Saudi Arabia, maintained voluntary production cuts, reducing global supply by almost 1.5 million barrels per day. This helped sustain an outlook of reduced supply during the early months of 2025.
- However, as the year progressed, a structural weakness in crude prices began to emerge, driven by a steady increase in U.S. production—a country outside OPEC+. In April, U.S. inventory data showed buildups far above expectations, and together with increasingly aggressive comments from OPEC+, this heightened concerns over a potential global oversupply, reinforcing a broader bearish bias.
- Later in the year, the market experienced a significant rebound, again tied to supply expectations—this time triggered by a geopolitical event in the Middle East. During June 2025, tensions between Israel and Iran escalated following a series of airstrikes and the launch of more than 150 ballistic missiles by Iran targeting Israeli facilities. Crude surged more than 20% amid fears over the stability of the Strait of Hormuz, through which roughly 20% of the world’s oil is transported. However, the conflict de-escalated quickly due to U.S. intervention, and crude prices soon returned to a downward trajectory.
- Shortly afterwards, in July, a new bearish catalyst emerged when OPEC+ announced a more aggressive production increase, raising supply by more than 400,000 barrels per day. These increases, which continued steadily through year-end, reactivated concerns over oversupply, restoring strong downward pressure on crude oil.
In summary, the main events of the year shared one common denominator: constant shifts in production expectations. This reinforces the lesson that supply dynamics remain one of the most decisive factors in assessing crude strength. For most of 2025, the market was shaped by expectations of higher production, a dynamic that became the central pillar behind the persistent weakness in crude prices, pushing WTI to levels not seen since 2021.
A Possible Peace Agreement Shapes the End of the Year
Toward the end of 2025, one of the key events contributing to WTI weakness has been progress toward a potential peace agreement between Russia and Ukraine. Markets reacted optimistically to recent comments in which Trump stated that an agreement is “closer than ever,” citing structured dialogue based on security guarantees for Ukraine. It is estimated that about 90% of the key points have already been negotiated among Ukraine, the European Union, and the United States; only Russia’s official approval remains before moving toward a formal agreement and an eventual ceasefire.
It is important to remember that, according to the latest available data, Russia produced roughly 9.8 million barrels per day in August, making it one of the three largest oil producers in the world. If a peace agreement leads to lifting economic sanctions, a full return of Russian crude to the market could intensify oversupply concerns.
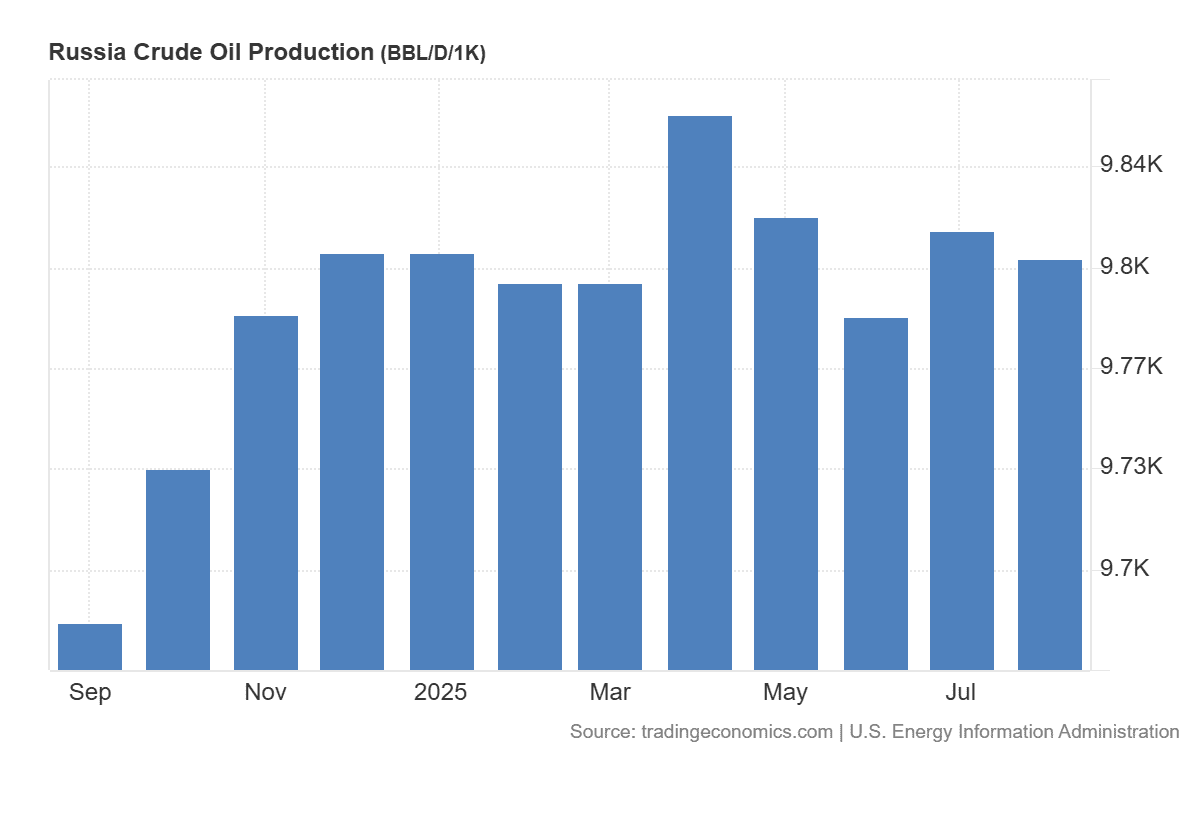
Source: TradingEconomics
With this in mind, greater supply—already a central driver of weakness in 2025—combined with demand that still shows no signs of solid recovery, could continue pressuring prices downward. If a peace agreement is finalized, together with ongoing OPEC+ increases and rising U.S. production, 2026 could be marked by a global oversupply scenario, likely sustaining persistent selling pressure in the months ahead.
What to Expect for WTI in 2026
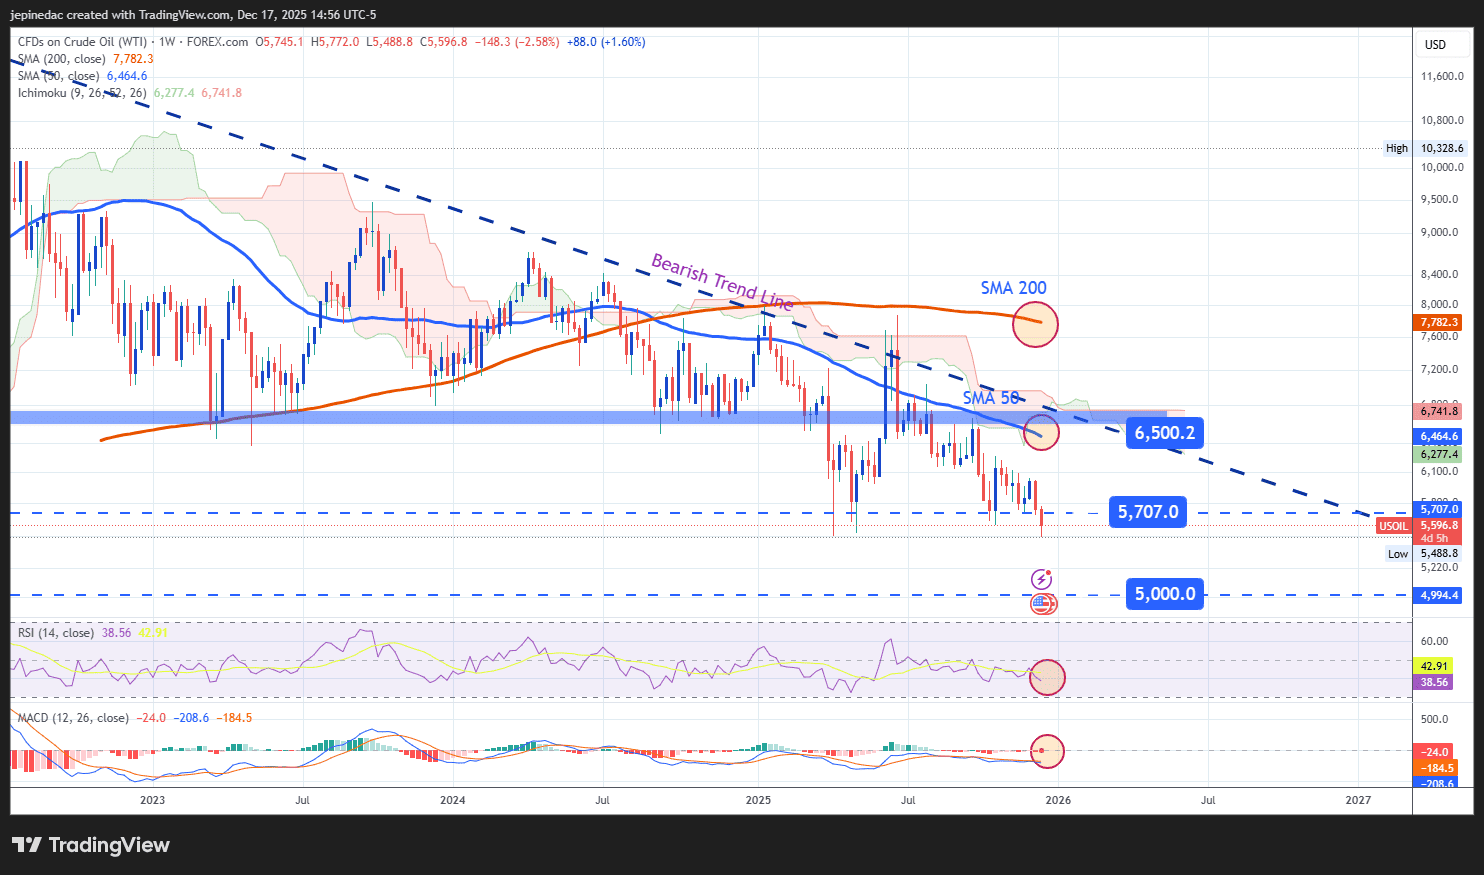
Source: StoneX, Tradingview
- The Downtrend Remains Dominant: Since May 2022, the WTI weekly chart has shown a consistent downward trend, with selling momentum once again pushing the price below 60 dollars. The absence of significant bullish corrections throughout 2025 keeps this formation as the most relevant long-term technical structure, likely to continue dominating downward movements in the coming months, especially if key support levels below psychological thresholds such as 60 and 50 dollars are broken. As long as price remains below the 50-week simple moving average, the market bias may remain bearish heading into 2026.
- RSI: The RSI has remained below the neutral 50 level for several weeks, suggesting that the average momentum continues to reflect a bearish bias. As long as RSI maintains consistent downward oscillations without entering the oversold zone (30), bearish pressure is likely to continue dominating WTI.
- MACD: The MACD shows slight oscillations below the zero line, indicating that the prevailing strength of the moving averages remains bearish. If MACD readings continue to decline in the coming months, selling pressure could intensify further.
Key Levels:
- 65 USD – Relevant resistance: This level corresponds to the zone where the long-term downtrend intersects with the 50-period moving average. Bullish movements that manage to return to this region could put the downtrend at risk and activate a stronger bullish bias in WTI.
- 57 USD – Nearby barrier: A level of persistent neutrality that has generated indecision in recent weeks. If prices fail to break above this zone, a more defined sideways range could develop.
- 50 USD – Key support: A level not seen since January 2021 and a significant psychological threshold. Bearish movements that reach or break below this area could reinforce a consistent selling bias, extending WTI’s ongoing downtrend.
Written by Julian Pineda, CFA, CMT – Market Analyst
Follow him at: @julianpineda25


