

Negotiations and Hormuz risks remain central to market direction, supporting rebounds across crude oil and US indices. At the same time, today’s US CPI print is expected to reflect persistent inflation pressures, driven by rising energy costs and supply disruptions linked to the Middle East conflict.
- The S&P 500 and Dow Jones are holding rebounds of over 8% from yearly lows, currently testing the 6,830 and 48,000 resistance levels respectively
- Nasdaq is rebounding over 10% from yearly lows, approaching the 25,200 resistance level
- Crude oil has rebounded over 10% from the recent $85 low, holding above the $90 threshold
US indices are maintaining their recovery, supported by constructive technical signals while testing critical resistance levels. This comes as Middle East negotiations fluctuate between optimism and uncertainty, with ongoing risks tied to Hormuz disruption and its implications for global supply chains, energy prices, and inflation.
In crude oil markets, renewed rhetoric around Hormuz risks has pushed prices higher by more than 10%, reinforcing inflationary pressures already visible globally, particularly in fuel and energy costs. This keeps the risk premium elevated and places strong focus on today’s US CPI data.
Today’s US CPI Expectations
- Core CPI (m/m): 0.2% → 0.3%
- CPI (m/m): 0.3% → 1.0%
- CPI (y/y): 2.4% → 3.4%
A reading in line with or above these expectations would reinforce upside risks for the US dollar, while increasing downside pressure on US indices and precious metals, particularly as elevated energy prices and higher insurance premiums linked to Hormuz disruptions persist.
Crude Oil Price Outlook: 2 Week Time Frame – Log Scale
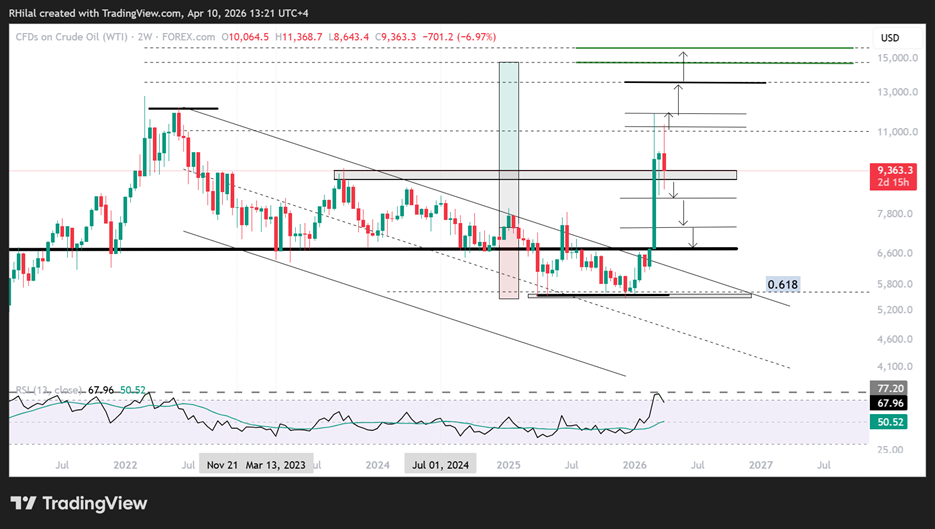
Source: Trading view
Crude oil price action can be divided into three key zones:
Upper range (strength continuation):
Price remains above the 2023 highs, with weekly closes holding above the $88 zone. A move above $110 and $118 could open the path toward $135, $145, and the $157–160 range.
Middle range (stabilization zone):
A move below $84 may still see strong rejection from this level. However, a confirmed break could expose downside toward $82 and $74, aligning with previous Middle East conflict highs.
Lower range (extended weakness):
A weekly close below $74 could expose a move toward the $60 zone, signaling a return to broader consolidation aligned with policy normalization trends.
With prices heavily driven by headlines, it remains essential to confirm moves through higher time frame closes to avoid noise during ongoing negotiations.
US Indices Price Outlook: Daily Time Frame – Log Scale
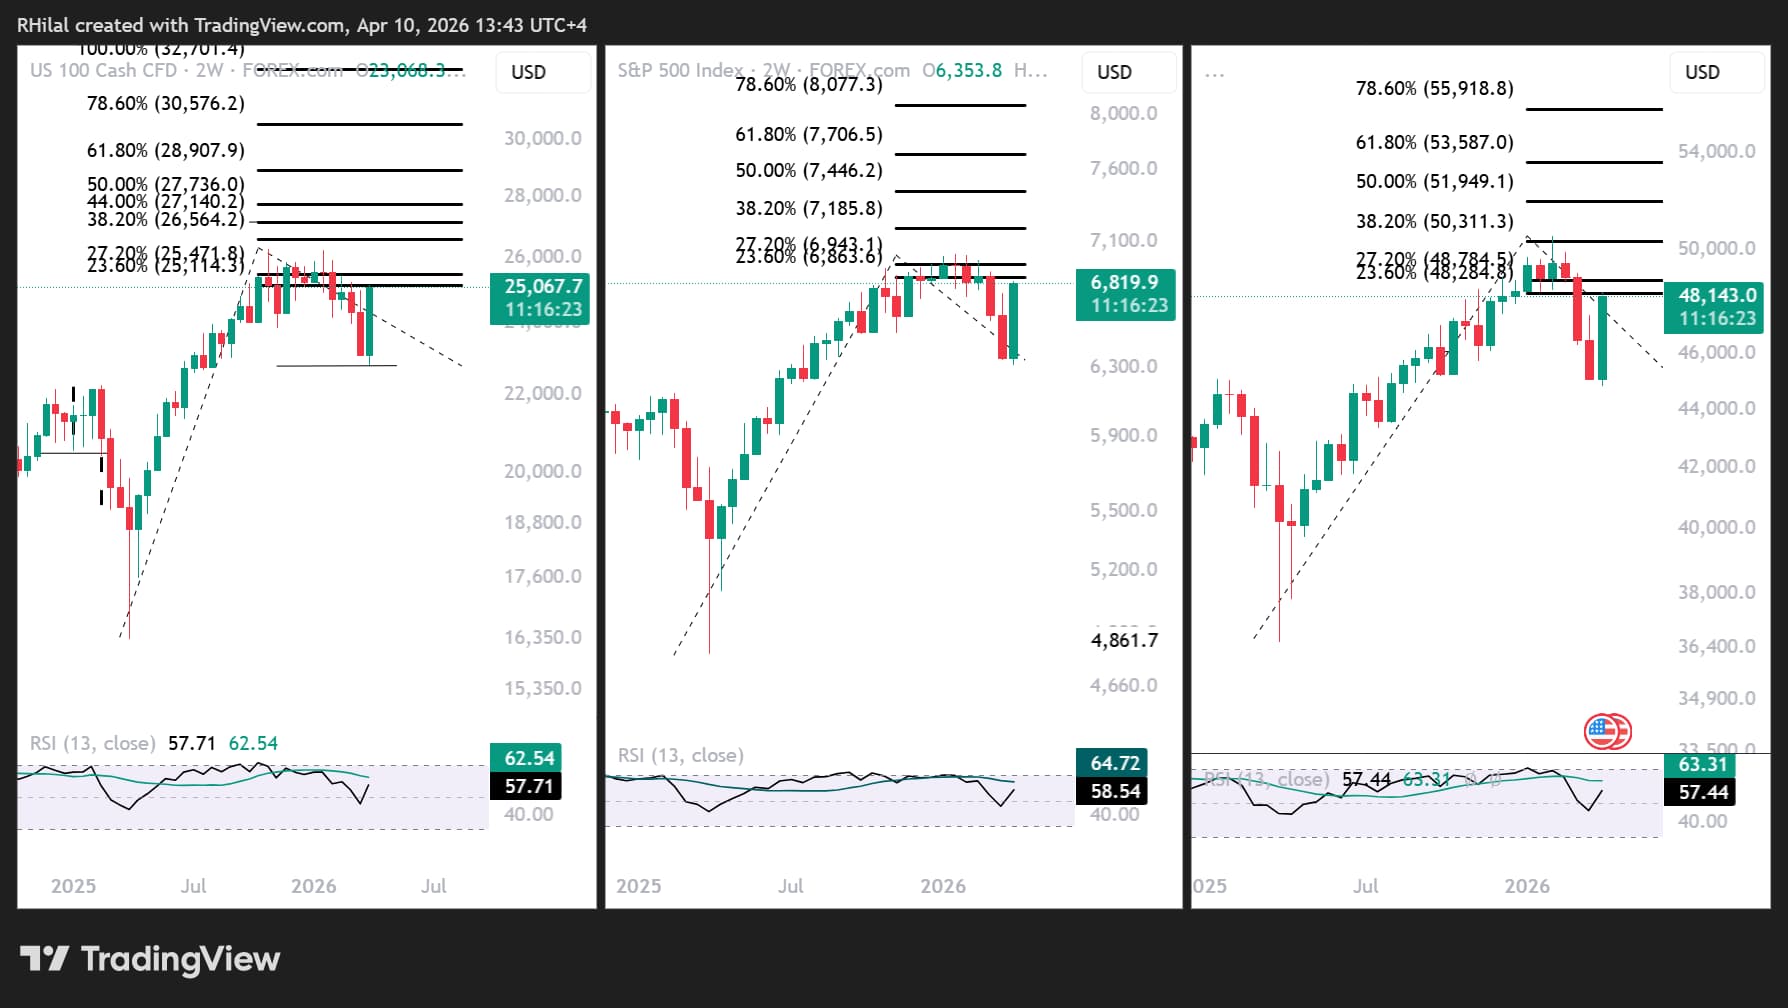
Source: Trading view
A similar structure is visible across Nasdaq, S&P 500, and Dow Jones, where recent rebounds are testing the 0.236 Fibonacci retracement of the move between April 2025 lows, January 2026 highs, and March 2026 lows.
This alignment suggests a constructive setup, where a break above resistance levels could reinforce market strength and risk appetite. Key levels include:
- Nasdaq: 25,000–25,500
- S&P 500: 6,830–6,940
- Dow Jones: 48,200–48,800
On the downside, pullback risks remain given inflation pressures tied to energy markets. If negotiations deteriorate or extend, key support levels to watch include:
- Nasdaq: 24,200–23,800
- S&P 500: 6,600–6,530
- Dow Jones: 46,800–46,200
In line with the broader outlook, headline-driven sentiment may continue to trigger sharp market swings. Higher time frame closes remain essential to confirm whether markets are entering a structural continuation or a reversal phase.
Written by Razan Hilal, CMT
Follow on X: @Rh_waves