

During the current trading session, WTI crude oil has posted a short-term decline of more than 3.0%. The selling pressure that has begun to gain traction is mainly driven by the de-escalation of risks surrounding a potential military intervention in Iran, which has reduced the market’s perception of a possible disruption to global crude supply. Against this backdrop, the steady demand seen in previous sessions has started to weaken, and as long as a renewed sense of risk does not emerge, selling pressure may continue to dominate short-term price action in crude oil.

Geopolitical tensions de-escalate
At the beginning of January, internal protests in Iran were met with heavy repression, increasing concerns over domestic instability. In that environment, the tone of official statements—particularly from the United States—intensified, fueling speculation about a potential military intervention. Iran responded by warning of possible retaliation, which markets interpreted as a risk to the security of the Strait of Hormuz, a key passage through which nearly 20% of the world’s oil supply is transported. Any disruption to this strategic route could have led to a short-term interruption in crude supply.
However, the current environment largely explains the renewed weakness in WTI, as geopolitical tensions have eased. Statements from the White House have ruled out a near-term military intervention, emphasizing diplomatic pressure instead. At the same time, Iran has reopened its airspace around the capital, suggesting that no immediate intervention threats from other countries are expected.
At this stage, markets are no longer assigning a high probability to a meaningful disruption in crude production in the short term. This shift has triggered a new wave of selling and a more consistent bearish bias. This scenario may persist as long as geopolitical risk linked to Iran does not re-emerge in a way that directly impacts Middle Eastern crude production.
Is risk perception fading?
Currently, the oil implied volatility index (OVX), which measures expected volatility in WTI over the next 30 days, has started to retreat from levels not seen since June 2025, and is now hovering around the 42-point area. This move reflects a decline in expected market volatility, suggesting a lower probability of sharp price swings in the near term.
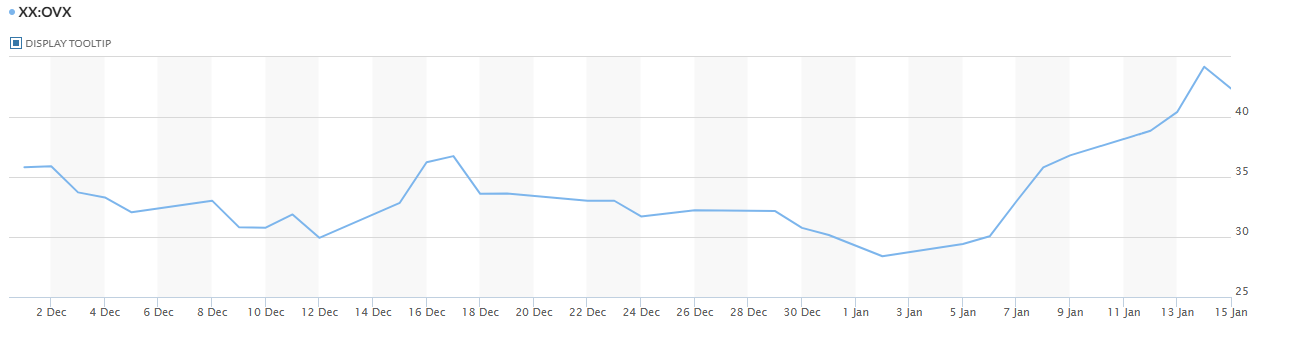
Source: Marketwatch
As OVX continues to post lower readings, market expectations may tilt back toward a more stable price environment for crude oil. This would reduce the likelihood of rapid upside spikes and could reinforce a sense of indecision, potentially supporting continued selling pressure in WTI over the short term.
WTI Technical Outlook
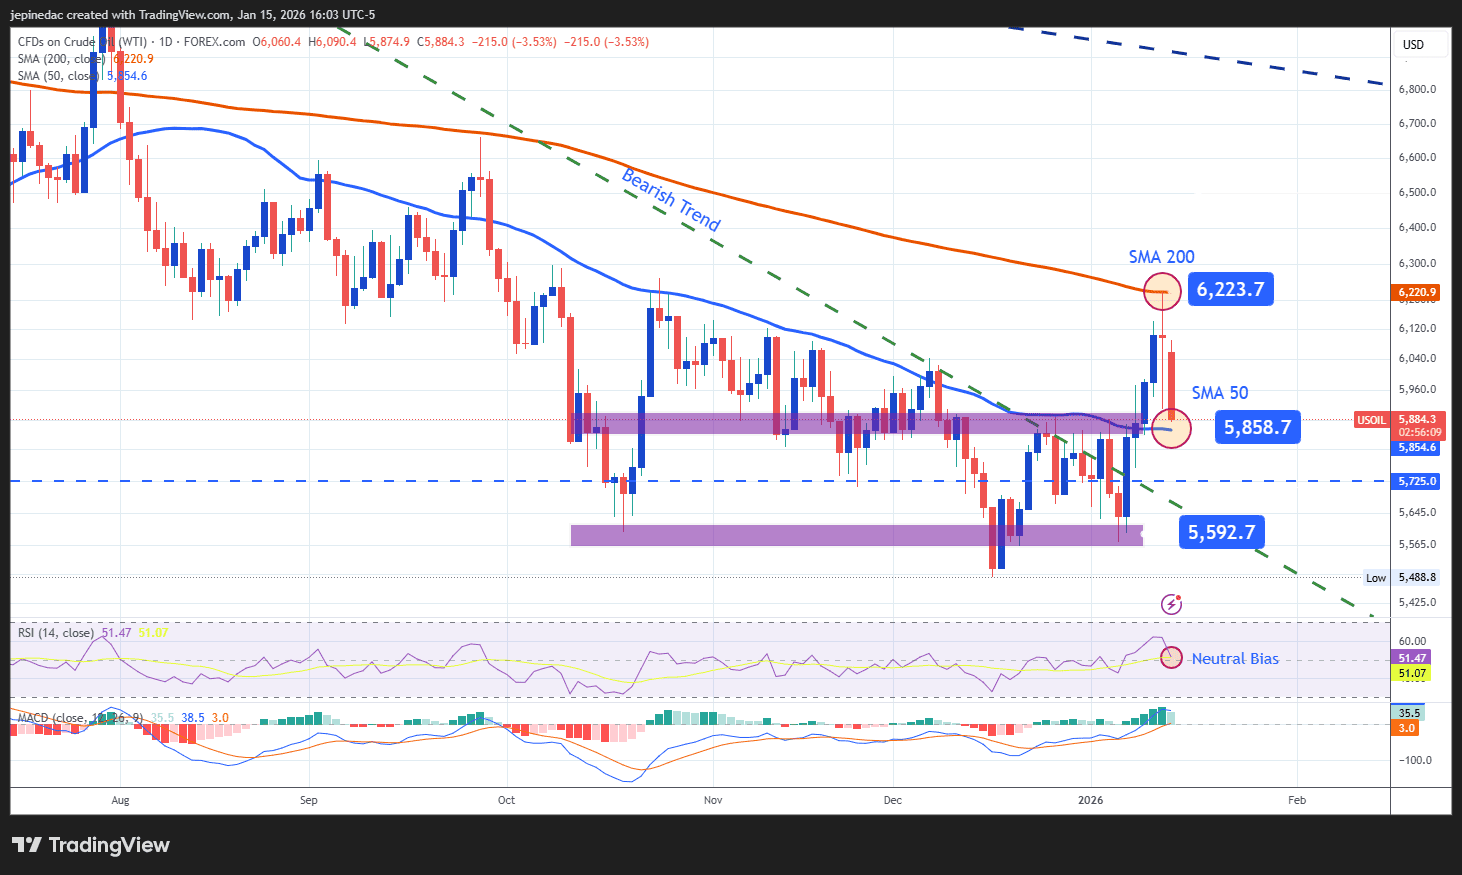
Source: StoneX, Tradingview
- An indecision phase is developing: In just a few sessions, WTI prices have moved from trading near $62 to once again oscillating below the $60 level. Recent volatility spikes, rather than confirming a clear directional move, have given way to a phase of indecision on the chart. Although oil attempted to form a new bullish trendline in earlier sessions, the latest selloff has pushed prices back into a neutral environment, increasing the likelihood of a short-term sideways range.
- RSI: The RSI is once again approaching the neutral 50 level, suggesting a balance between buying and selling momentum over the past 14 sessions. As long as the indicator remains in this zone, WTI is likely to continue showing short-term neutrality.
- MACD: The MACD has begun to show a consistent pullback in its histogram from recent highs, indicating that buying momentum in the moving averages has lost strength. This behavior reinforces the view that the market is entering a short-term indecision phase.
Key Levels:
- $62 – Key resistance: This level aligns with the 200-period simple moving average and represents the most important upside barrier in the short term. A sustained break above this area could signal a structural shift and open the door to a new bullish trend.
- $58 – Nearby barrier: A neutrality level aligned with the 50-period simple moving average. Price action around this zone could consolidate a short-term sideways phase.
- $55 – Key support: This level marks the 2025 lows and stands out as the most relevant downside barrier. Sustained moves below this area would reinforce a dominant bearish bias, extending the downside pressure seen in recent months.
Written by Julian Pineda, CFA, CMT – Market Analyst
Follow him on: @julianpineda25