


It has been a challenging week for Dow Jones price action, as the index has lost value consistently over the last two trading sessions, declining by more than 2.4%, which has led to the emergence of a new short-term bearish bias.
Selling pressure has remained steady on the chart, in a context where the U.S. central bank maintains a more aggressive stance, limiting the possibility of a lower interest rate environment that could support equity market confidence. This scenario has started to generate sustained weakness in indices such as the Dow Jones, while alternative markets begin to gain attractiveness. If this perception persists, selling pressure is likely to continue dominating price action in the coming sessions.

The central bank becomes the main headwind
During yesterday’s session, the Federal Reserve released its interest rate decision, keeping rates unchanged at 3.75%, in line with a neutral stance. However, it was Jerome Powell’s speech that ultimately drove market behavior.
Powell emphasized concerns regarding inflation dynamics, noting that the recent increase in energy prices, driven by the Middle East conflict, could lead to additional inflationary pressures in the coming months. This suggests that expectations for rate cuts in the near term have declined significantly.
In fact, the CME Group probability outlook shows that a potential rate cut toward 3.5% may not occur until September 2027, with a probability of around 43.0%, reinforcing the view of a higher-for-longer rate environment.
This scenario is not favorable for equity markets. On one hand, higher inflationary pressures tend to increase corporate costs and reduce margins. On the other hand, the lack of rate cuts keeps financing costs elevated, which can weigh on consumption and corporate profitability.
Given that the Dow Jones is largely composed of industrial, consumer, and traditional companies, the index may be particularly sensitive to these dynamics. This weakness is already reflected in its main components, with declines in Goldman Sachs (-0.38%), Caterpillar (-1.57%), Microsoft (-0.71%), Amgen (-0.33%), and Home Depot (-1.22%), highlighting broad-based selling pressure across sectors.
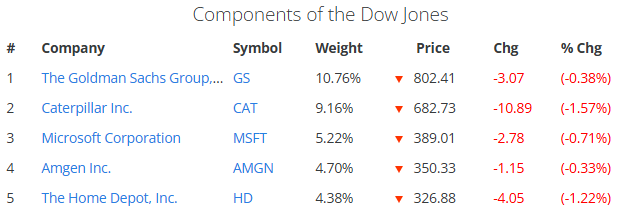
Source: Slickcharts
Another relevant development following the central bank decision has been the behavior of the U.S. 10-year Treasury yield, which has risen again toward the 4.27% level, approaching its highest levels in recent weeks. This move has restored attractiveness to the fixed income market, which currently stands out as a more stable alternative compared to equities.
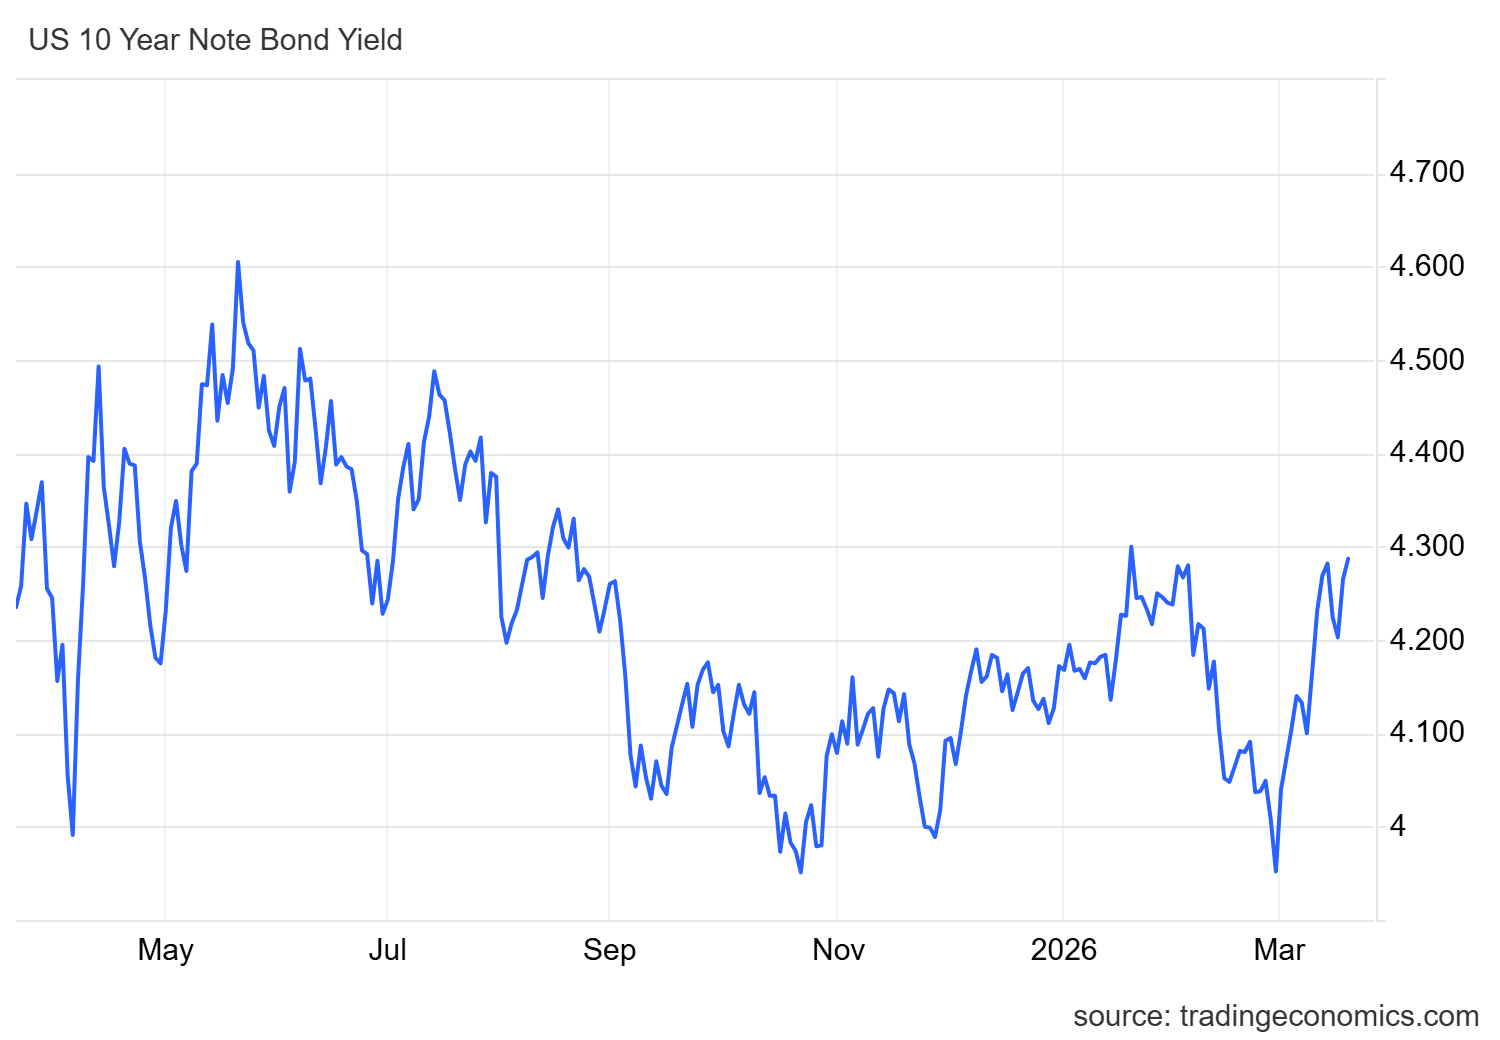
Source: TradingEconomics
In this context, rising yields may be driving a rotation of capital into bonds, limiting the recovery potential of indices such as the Dow Jones in the short term. As this market gains traction, risk assets may continue to face challenges in establishing a sustained rebound.
With this in mind, the combination of persistent inflationary pressures, a more aggressive central bank stance, and confidence that has yet to fully stabilize continues to support a weak environment for equity markets. If these dynamics persist, selling pressure is likely to remain dominant in Dow Jones price action in the coming sessions.
Confidence begins to show sensitivity
According to the AAII Sentiment Survey, equity market sentiment for the next six months stands at 30.4% bullish, 17.6% neutral, and 52.0% bearish, based on data as of March 18, 2026.
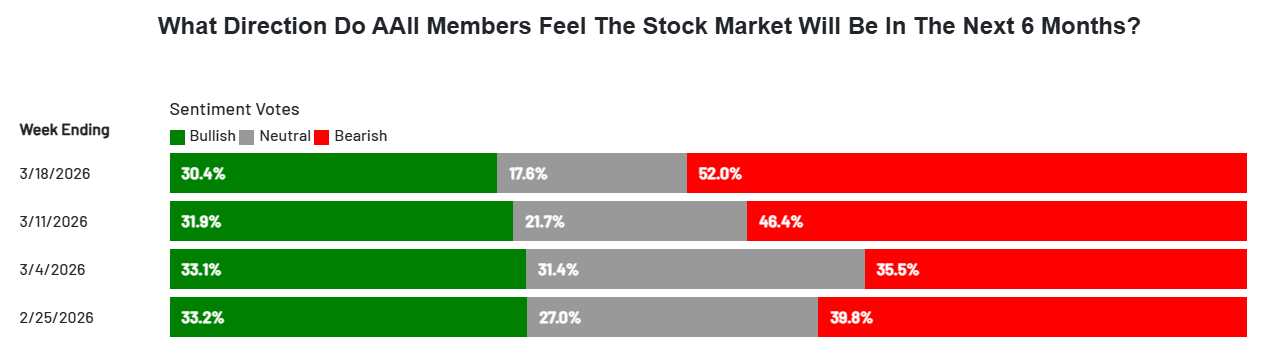
Source: AAII
These figures reflect a general perception of weakness in equity markets, along with an increase in pessimism in recent weeks. If this trend continues, it could limit the development of sustained demand, making it more difficult for the Dow Jones to recover in the short term.
Dow Jones Technical Outlook
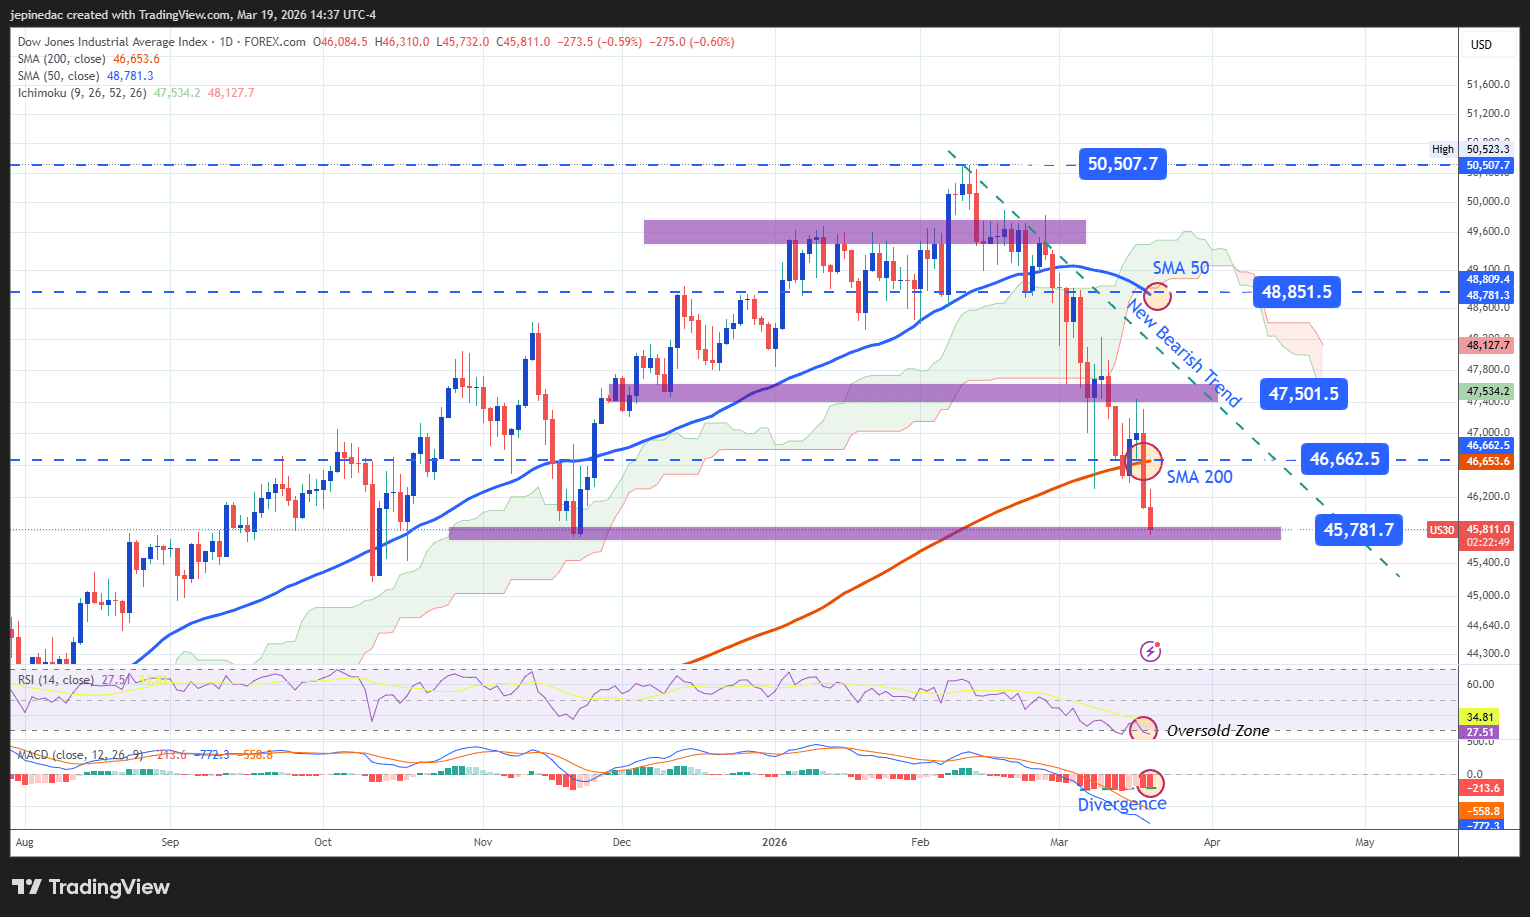
Source: StoneX, Tradingview
- Bearish move begins to consolidate: Recent Dow Jones price action has started to form a potential downward trendline, which is gradually becoming one of the most relevant technical structures on the chart. If selling pressure persists, this structure could strengthen and dominate price movements in the coming weeks. However, it is important to note that selling pressure is beginning to show early signs of exhaustion, which could open the door to short-term bullish corrections.
- RSI: The RSI indicator remains below the 50 level, confirming the dominance of bearish momentum. However, it is approaching the oversold zone (30), which may indicate that the market is entering levels where technical rebounds could begin to appear.
- MACD: The MACD maintains a bearish bias, with the histogram below 0, but a potential bullish divergence is emerging, as price continues to make lower lows while the indicator forms higher lows. This could signal a phase of indecision or short-term corrective movement.
Key levels:
- 47,500 points – Key resistance: Level corresponding to a neutrality zone above the current downward trendline. A move above this area could invalidate the bearish structure and open the door to a bullish bias in the coming sessions.
- 46,662 points – Near-term barrier: Neutral zone aligned with the 200-period moving average. Price action around this level could reinforce a short-term indecision phase.
- 45,780 points – Key support: Level not seen since November 2025. A break below this area could reinforce the current bearish bias and extend the downtrend in the short term.
Written by Julian Pineda, CFA, CMT – Market Analyst
Follow him on: @julianpineda25


