
The euro was given a boost on Thursday by a weaker US dollar, following soft employment data that increased expectations of a December Fed rate cut. EUR/USD rose 0.5% to a four-day high, forming a morning star reversal pattern on the daily chart that suggests a potential bullish turn. The US dollar index fell back below 100, signalling a near-term top. The euro made notable gains against commodity currencies but was mixed against other FX majors.
View related analysis:
- 153 Remains Pivotal For USD/JPY, AUD/USD Stabilises with Wall Street Bounce
- USD/JPY Outlook: Japanese Yen Dominates Amid Wall Street Selloff
- US Dollar Eyes Breakout as EUR/USD, GBP/USD Probe Support, USD/JPY Rallies
- US Dollar Leads FX Majors After Hawkish FOMC: USD/JPY, AUD/USD in Focus
Euro Strength Broadens Across Commodity FX
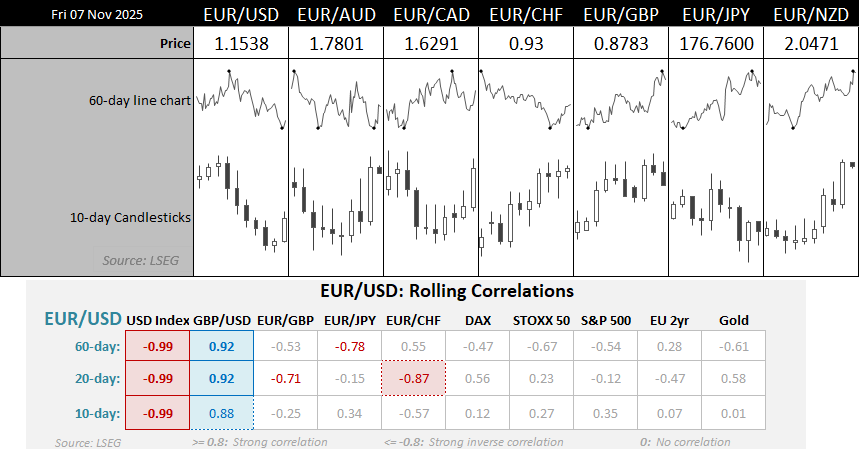
Charts prepared by Matt Simpson, Source: LSEG
- Growing expectations of a 50-bp RBNZ cut in December allowed the euro to take full advantage of a weaker New Zealand dollar, sending EUR/NZD up 0.9% to its highest level since November 2009.
- Weaker oil prices weighed on the Canadian dollar, with EUR/CAD rising 0.5% to a seven-day high.
- EUR/AUD climbed 0.9%, marking its strongest session in 19 days.
- EUR/GBP retraced for a second day after the Bank of England (BoE) held rates at 4%, with the British pound also gaining against the US dollar.
- While the euro rose slightly against the Swiss franc and fell marginally versus the Japanese yen, both moves were effectively flat on the day.

EUR/AUD Technical Analysis: Euro vs Australian Dollar
The euro has been oscillating within a ~500-pip range since June, which has allowed some decent swings on tej daily chart despite its lack of trend. Yet momentum has turned highs from the range lows after support was found around its 200-day averages. Moreover, EUR/AUD enjoyed its best day in nearly four weeks on Thursday to strongly suggest the swing low has been seen. And if its recent pattern holds true, EUR/AUD bulls could be looking at anther 280 pips of upside before we find out whether it wants to roll over back within range once more, or finally breakout.
Given my bias for a stronger Australian dollar as we get towards December, for now my bias is for a move to 1.8 or the range highs around 1.81 before momentum reverses. Bulls could seek dips within Thursday’s range or seek continuation patterns on lower timeframes.
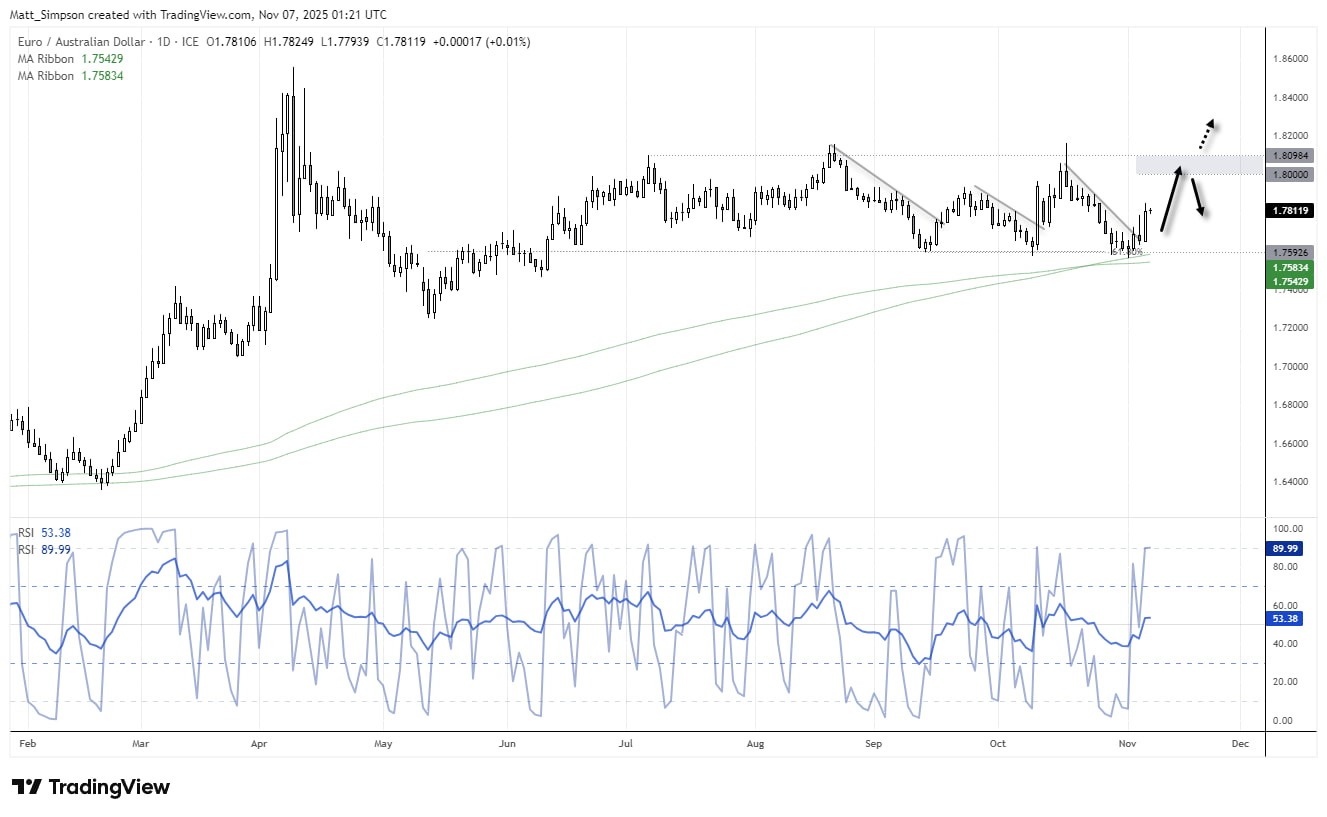
Chart analysis by Matt Simpson - data source: TradingView EUR/AUD

EUR/NZD Technical Analysis: Euro vs New Zealand Dollar
I have zoomed out on the monthly to show how strong the bullish rally is on EUR/NZD. The currency cross made light work of breaking above the 2.0 handle and currently sits at a 16-year high with no immediate signs of a top forming. Momentum is strong to the upside, and while the monthly RSI (14) is overbought, there is nowhere else it should be during a strong uptrend – and there is no bearish divergence.
The daily chart shows a classic bullish trend with characteristics usually associated with a stock price. Timely higher lows have formed along the 50-day EMA, though its most recent retracement didn’t even test the average to show bullish momentum id increasing.
It looks like a move to at lest 2.10 could be on the cards, highs around 2.1170 also being a possibility. Bulls could seek dips towards the averages until signs of a topping pattern emerge.

Chart analysis by Matt Simpson - data source: TradingView EUR/NZD
View the full economic calendar
-- Written by Matt Simpson
Follow Matt on Twitter @cLeverEdge
How to trade with City Index
You can trade with City Index by following these four easy steps:
- Open an account, or log in if you’re already a customer
• Open an account in the UK
• Open an account in Australia
• Open an account in Singapore
- Search for the market you want to trade in our award-winning platform
- Choose your position and size, and your stop and limit levels
- Place the trade