


This time last year, I genuinely thought EUR/JPY was set up for a bearish 2025. The European economy looked weak enough to justify multiple rate cuts from the European Central Bank, while the Bank of Japan appeared primed to hike rates to levels not seen in decades. This was exactly the kind of policy divergence currency traders look for, with the added tailwind of yen demand amid expectations of a volatile first term for US President Donald Trump.
From a technical perspective, EUR/JPY was on track to print a shooting star on the yearly chart, while a loose head-and-shoulders formation appeared to be developing on the monthly chart. Taken together, it looked like a clear recipe for a materially weaker EUR/JPY.
View related analysis:
- Japanese Yen Weakens Despite BOJ Hike to 3-Decade High
- Why I have my eyes on a bearish prize for EUR/JPY in 2025
- EUR/JPY Prods the Neckline of a Mammoth Bearish Reversal Pattern
Why EUR/JPY Looked Set for a Bearish 2025
At the macro level, the setup appeared straightforward. Europe’s growth outlook was deteriorating, inflation pressures were easing, and markets were positioning for an extended ECB cutting cycle. Japan, by contrast, was finally emerging from decades of ultra-loose policy, with traders expecting the BOJ to normalise rates more aggressively.
Technically, the warning signs were also there. A potential shooting star near long-term resistance suggested exhaustion, while the developing head-and-shoulders structure pointed to downside risk if support gave way. With fundamentals and charts aligned, the bearish EUR/JPY case looked compelling.
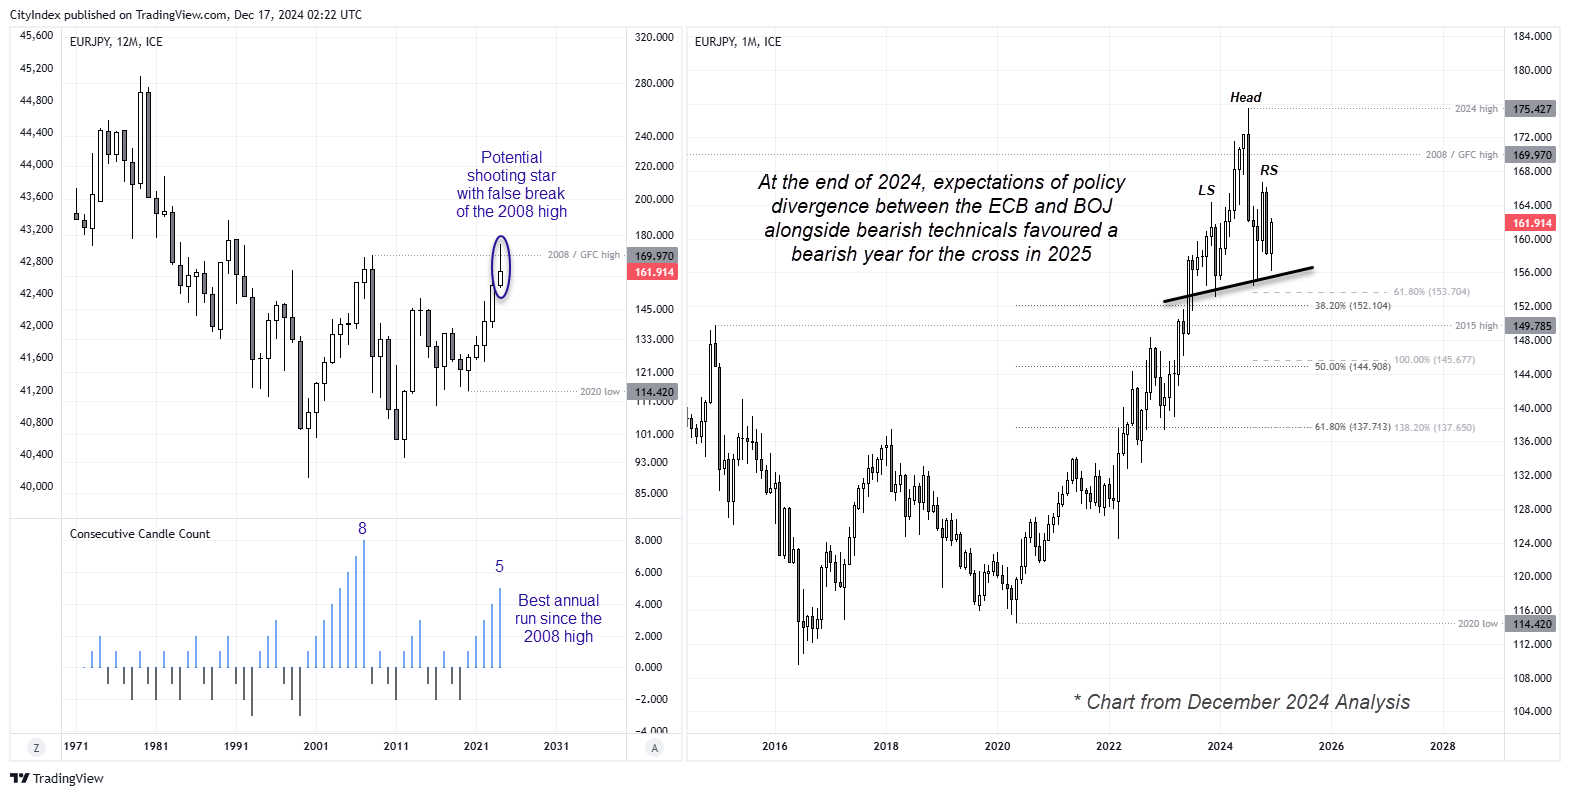
Chart analysis by Matt Simpson - data source: ICE, TradingView

2025 Had Other Plans for EUR/JPY
Instead, EUR/JPY is up 13.3% year to date at the time of writing — or nearly 20% from the February low — proving that view decisively wrong. Not only has the cross risen for a sixth consecutive year, 2025 has been its strongest year in 12, and it now trades just 2% below its 1990 high.
So what went wrong? The macro logic wasn’t entirely flawed, but the intensity and market impact were misjudged. The short EUR/JPY thesis looked promising in Q1, with long yen positions surging on expectations of a hawkish BOJ. In reality, the central bank has only just hiked rates to 0.75% in recent weeks — well short of the multiple hikes traders were positioned for a year ago. At the same time, the ECB proved less dovish than expected, helping underpin the euro.
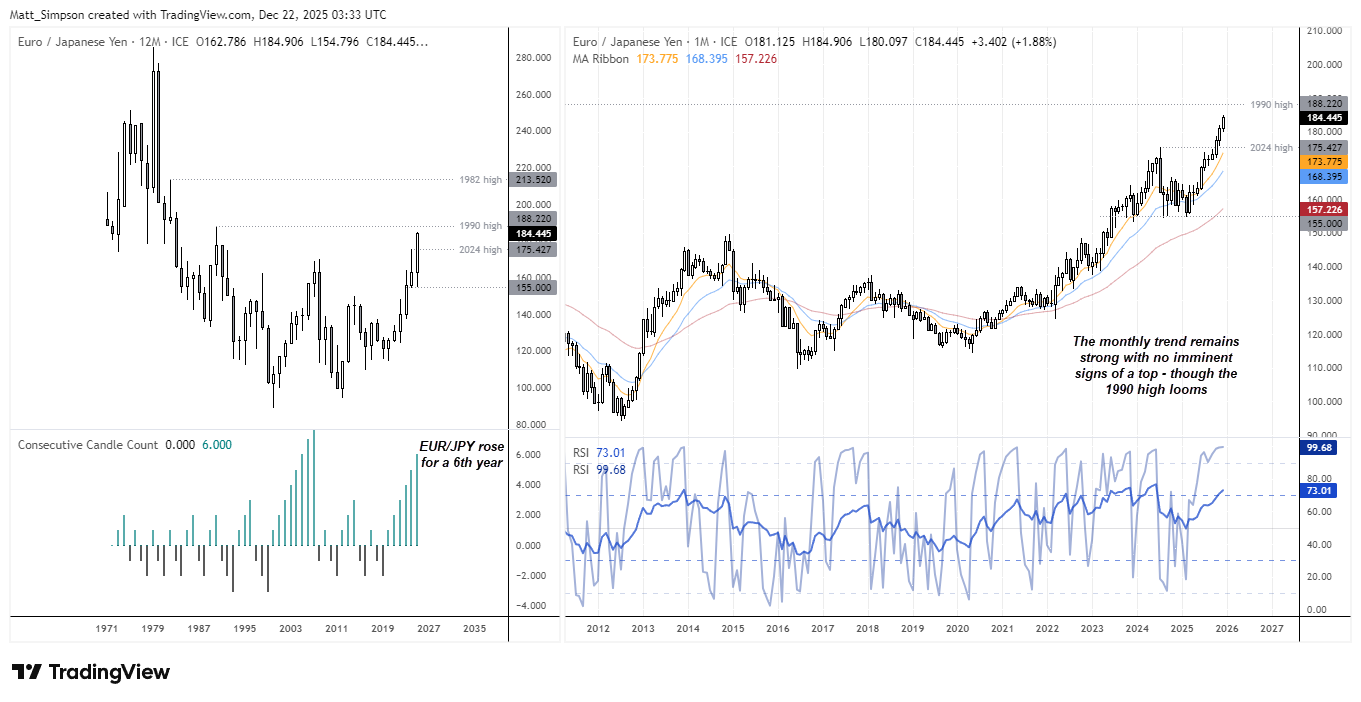
Chart analysis by Matt Simpson - data source: ICE, TradingView
Trump’s Tariff Reversal Undermined Yen Support
The real fly in the ointment may have been trade policy rather than central banks. While the initial threat of aggressive tariffs triggered risk-off flows that supported the yen, the subsequent reversal of those tariffs proved far more bullish for risk appetite than the original threats were ever bearish.
As risk sentiment improved, safe-haven demand for the yen faded, undermining one of the key pillars of the bearish EUR/JPY case. That shift ultimately worked against the yen — and helped keep EUR/JPY bid despite what initially looked like a textbook setup for a lower cross.

EUR/JPY Technical Outlook: Euro vs Japanese Yen
The monthly chart remains in a strong uptrend, with no imminent sign of a top. While prices are clearly extended from their 10- and 20-month moving averages and monthly RSI is overbought, those conditions alone are not reversal signals.
A pullback at some point is inevitable — particularly if the Bank of Japan delivers another rate hike — but stripping away expectations and focusing purely on price action, it is difficult to argue for a sustained bearish reversal. At this stage, the more likely outcome remains a series of natural retracements within a broader bullish trend.
After disappointing hawks for most of the past year, the BOJ has already shown it can underdeliver. There is little reason to assume next year will be materially different.
View the full economic calendar
-- Written by Matt Simpson
Follow Matt on Twitter @cLeverEdge
How to trade with City Index
You can trade with City Index by following these four easy steps:
- Open an account, or log in if you’re already a customer
• Open an account in the UK
• Open an account in Australia
• Open an account in Singapore
- Search for the market you want to trade in our award-winning platform
- Choose your position and size, and your stop and limit levels
- Place the trade


