


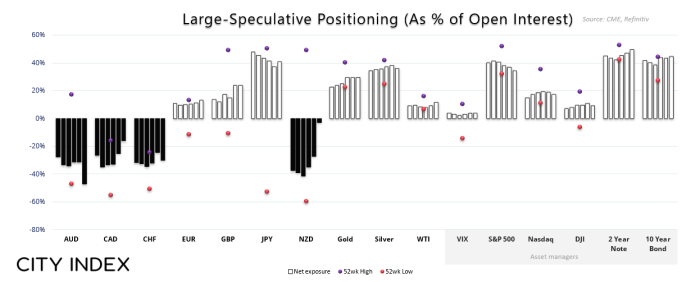
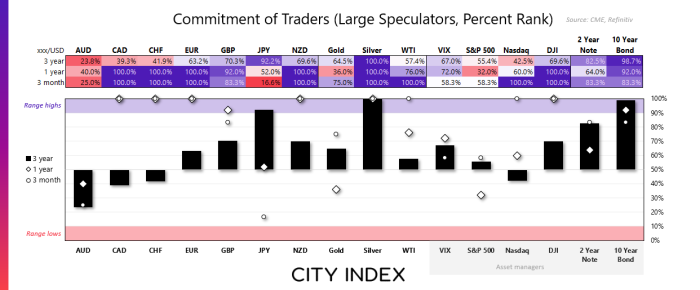
Speculative positioning across futures markets showed notable shifts in the week ending 20 May 2025. Net-long exposure to the New Zealand dollar surged at its fastest pace in seven years, while traders extended their bullish bias toward the euro. In contrast, metals markets saw a divergence, with silver approaching a sentiment extreme as gold speculators remained cautious. Meanwhile, Wall Street futures posted modest net-long increases, but positioning remains well below 2024 peaks.
View related analysis:
- USD Net Shorts Hit Record as AUD Bears Rise, CAD and EUR Gain – COT Report
- AUD/USD Weekly Outlook: Aussie Slides as Oil Surges on Middle East Tensions
- Australian Dollar Outlook: Will AUD/USD Follow NZD/USD Lower?
- Crude Oil Outlook: Will WTI Extend Gains or Fade as Middle East Tensions Peak?
Weekly Market Positioning Overview – COT Report Highlights (17 June 2025)
• US Dollar (USD): Asset managers trimmed their record-high level of net-short exposure to the US dollar by a mere -75 contracts, while large speculators increased their by 3l contracts
• European dollar (EUR): Large speculators increased net-long exposure to the euro by 8.5k contracts to an 18-month high
• British pound (GBP): Traders reduced net-long exposure to GBP/USD futures by -8.7k contracts (shorts rose 6.7%, longs trimmed by -4.3%).
• Japanese yen (JPY): Net-long exposure fell -13.7k contracts, mostly driven by a 13% increase of gross-shorts (5.2k contracts)
• Australian dollar (AUD): Gross-longs reduced to AUD/USD futures by -11.7% (-2.8k), though net-short exposure was effectively flat
• Canadian dollar (CAD): Traders increased their gross-long exposure to CAD by 18.2% (7.4k contracts), and reduced shorts by -16.2% (-18.3k)
• Swiss franc (CHF): Traders reduced their overall exposure by reducing longs by -15% (-12k contracts) and also lowering shorts by -8.5% (-2.6k contracts)
• New Zealand dollar (NZD): Traders were on the cusp of flipping to net-long exposure by decreasing net-short exposure by 20k contracts
• Gold (GC): Large speculators increased net-long exposure by 6.4k contracts’
• Silver (SI): Bets against silver were on the rise with gross-shorts increasing by 17.7% (3.3k contracts)
• Crude Oil (WTI): Traders reduced short bets against crude oil by -16.2% (-22.5k contracts)
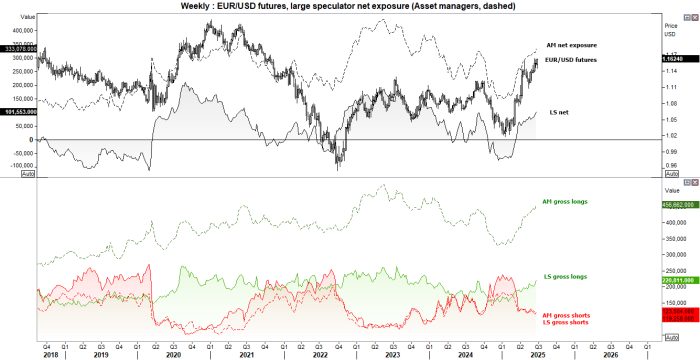
EUR/USD Positioning: Euro Futures – Weekly COT Report
Asset managers increased their net-long exposure to EUR/USD future to a 16-month high, large speculators increased theirs to a 15-month high. And with the euro considering a break of its three-year, nine-month high at the time of writing, it is hard to be bullish on the US dollar index right now – despite stretched net-short exposure.
While large speculators saw a slight increase of gross-shorts, they also increased longs to their highest level since December 2023. And with net-long exposure not at a sentiment extreme for either trader, the EUR/USD could be looking at further gains to the detriment of the US dollar index.
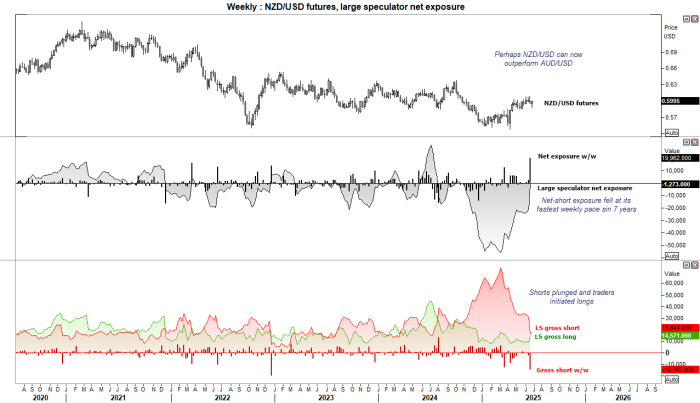
NZD/USD Positioning: New Zealand Dollar Futures – Weekly COT Report
Net-long exposure to New Zealand dollar futures surged at their fastest weekly pace seven years. The 202k increase was fuelled by a reduction of -14.7k short contracts, its fastest pace since December 2022, and a 5.3k contract rise of longs. Asset managers also followed the same pattern of closing NZD/USD shorts in exchange for longs.
This coincided with positive developments from the US-China trade talks, after the Reserve Bank of New Zealand (RBNZ) had already dopped hints that the easing cycle was at or near an end. Perhaps NZD/USD will now be the outperformer over AUD/USD, given the potential for at least two more 25bp cuts from the Reserve Bank of Australian (RBA) this year.
Metals (Gold, Silver, Copper) Futures - COT report
While gold and silver prices have generally tracked each other higher in recent weeks, there is a clear divergence between the market positioning of the two. It is also plausible that silver positioning has reached a sentiment extreme, and gold’s gains could be capped with large speculators and managed funds less keen on chasing gold prices higher.
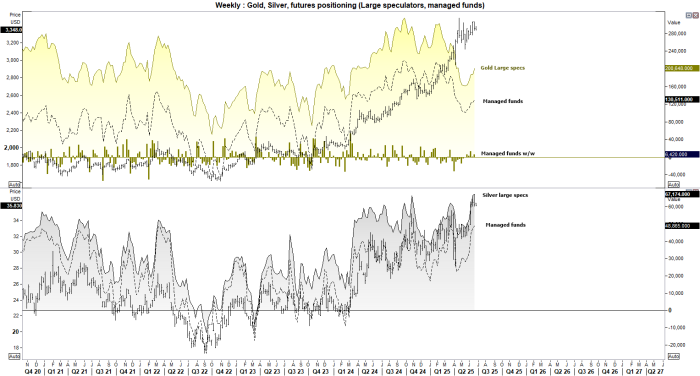
Gold Futures Positioning (GC): Weekly COT Report Analysis
• Large speculators and managed funds increased their net-long exposure to gold futures by a combined 21.5k contracts
• Net-long exposure is sitting around 10-week highs among both sets of traders
• Whole net-long exposure to gold has been trending higher in recent weeks, it remains low relative to prices to warn of caution among the larger players

Silver Futures Positioning (SI): Weekly COT Report Analysis
• Net-long exposure to silver futures rose to a 5-year high among large speculators and a 13-week high among managed funds
• Both sets of traders increased longs and shorts to show a lack of clarity around these highs
• A shooting star candle also formed last week to suggest neat-term exhaustion to Silver’s trend
Wall Street Indices Positioning (S&P 500, Nasdaq 100): Weekly COT Report
Net-long exposure has been retracing lower on Wall Street futures this year. Given we’re nearly six months down already, perhaps we’re nearing the point where net-long exposure beings to increase.

S&P 500 Futures Positioning (ES): Weekly COT Report Analysis
• Asset managers increased net-long exposure to S&P 500 futures by 20.6k contracts
• Gross-longs were trimmed by -3.5k contracts
• Gross-shorts fell by -238k
• Given S&P 500 futures are back above 6100, perhaps it will gun for its record high

Nasdaq 100 Futures Positioning (NQ): Weekly COT Report Analysis
• Net-long exposure to Nasdaq 100 futures rose to the 16-week high of 22.4k contracts
• Gross longs and shorts were increased by 2.7k contracts
• Gross-shorts increased by 910 contacts
• Like the S&P 500, the Nasdaq 100 could be considering a break for its all-time high
How to trade with City Index
You can easily trade with City Index by using these four easy steps:
- Open an account, or log in if you’re already a customer
• Open an account in the UK
• Open an account in Australia
• Open an account in Singapore
- Search for the company you want to trade in our award-winning platform
- Choose your position and size, and your stop and limit levels
- Place the trade


