
The US dollar remains under pressure as EUR/USD and GBP/USD extend their bullish trends. While the Fed’s dot plot allows for two cuts this year, the reality will depend on incoming data. Powell reiterated this week that interest rates will stay in the 4.25–4.5% range until inflation shows clear responses to proposed tariffs. But with PCE inflation due Friday and nonfarm payrolls next week, markets could soon recalibrate their rate expectations—and that could dictate the next move for the dollar.
View related analysis:
- AUD/USD Outlook: RBA Rate Cut Likely as Inflation Hits 3.5-Year Low
- EUR/USD Bulls Gain Ground, NZD/USD Bullish Bets Surge: COT report
- AUD/USD Weekly Outlook: Aussie Slides as Oil Surges on Middle East Tensions
- Gold Price Outlook: Can Bearish Technical Setup and June Weakness Align?
Incoming PCE Inflation and Fed Expectations Drive EUR/USD and GBP/USD Trends
The Fed’s projections allow for two 25bp cuts this year, though whether they eventuate depends on incoming data. Powell told the House Financial Committee this week that rates will stay at 4.25–4.5% until there’s clear evidence on how tariffs are affecting inflation. He also warned that Trump’s proposed tariffs are likely to lift prices this summer as costs are passed on to consumers — noting they’re significantly higher than those imposed during the 2019 trade war.
That makes Friday’s PCE inflation report the more important one. While today’s GDP release will get some attention, it’s a final revision of Q1 data—making it relatively stale in the broader scheme of things. Next Friday’s nonfarm payrolls report will also be key, particularly if both inflation and employment data come in soft and reshape expectations for Fed policy.
With the Israel–Iran conflict fading from focus and Trump’s trade war less potent than before, traders may finally be able to refocus on monetary policy—and that means yields could drive currencies again. And if US data weakens, lower yields could weigh on the US dollar.

US Dollar Index (DXY) Technical Analysis
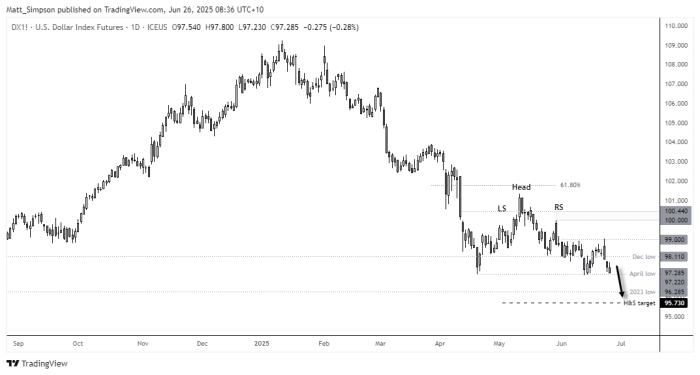
A head and shoulders (H&S) top projects a downside target for the US dollar index around 95.73. By textbook standards it’s debatable whether it qualifies, given the bearish breakout has lacked follow-through. Ideally, we want to see momentum accelerate out of such patterns. Still, the US dollar remains in a downtrend, and if incoming data justifies Fed cuts, the pattern argument becomes moot.
A bearish engulfing candle formed on Monday to mark a swing high around the 99 handle. Prices are now clinging to the April low at 97.28 for support. A break beneath the 97 handle could open the door to 96, which sits near the 2023 low (96.28) and the H&S target (95.73).

EUR/USD Technical Analysis: Euro vs US Dollar
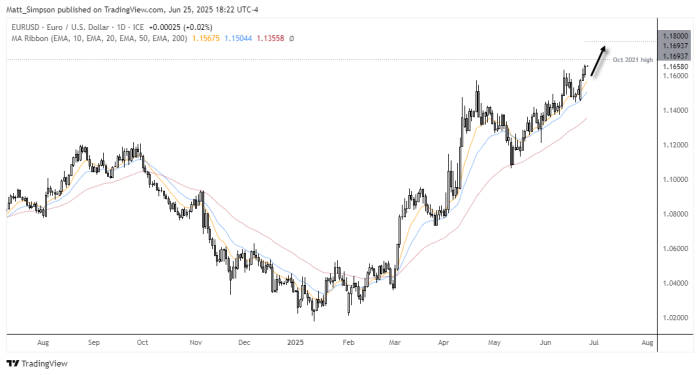
EUR/USD rose to its highest level since November 2021. As noted in this week’s COT report, euro bulls have continued to add to positions, with net-long exposure from both large speculators and asset managers still well below sentiment extremes. The pair now sits within a day’s typical range of the October 2021 high at 1.1693 and the key 1.17 handle — a break above which could open the door to 1.18.

GBP/USD Technical Analysis: British Pound vs US Dollar
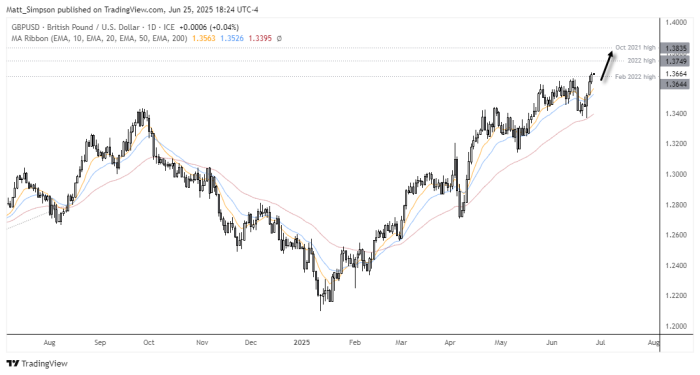
The British pound rose for a third straight session, lifting GBP/USD above the February 2021 high. With a solid bullish trend structure on the daily chart and the potential for softer US inflation to revive Fed rate-cut expectations, GBP/USD looks poised to test the 2022 high at 1.3749. A break above that level would bring the October 2021 high at 1.3835 into focus.
USD/JPY Technical Analysis: US Dollar vs Japanese Yen
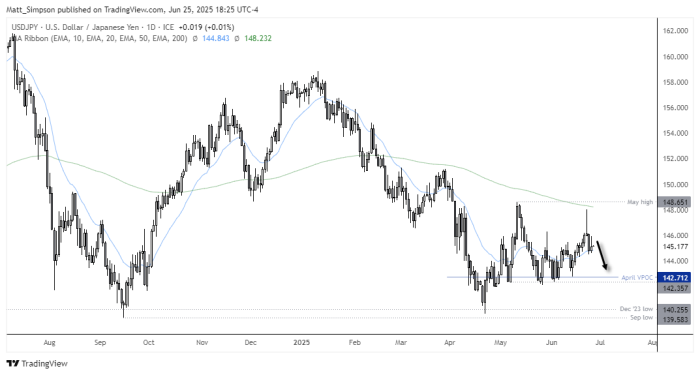
A bearish pinbar formed on Monday to mark a prominent swing high for USD/JPY just below the 200-day EMA (148.23). Tuesday’s bearish follow-through completes a 3-day Evening Star reversal pattern. A break beneath Tuesday’s low (144.58) could open the door to 144.00 and a potential revisit of the April volume point of control (VPOC) at 142.71.

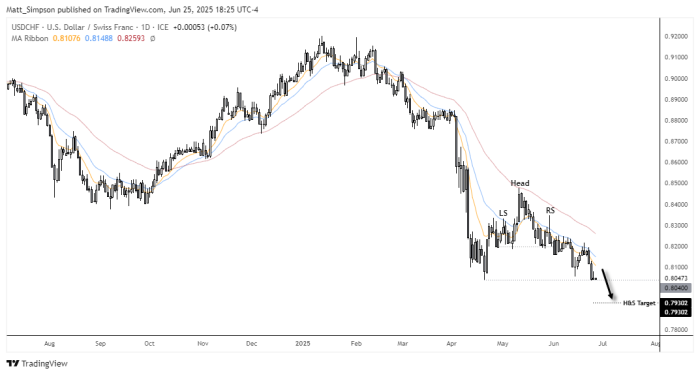
USD/CHF Technical Analysis: US Dollar vs Swiss Franc
The Swiss franc continues to mirror the US dollar index. A head and shoulders top on USD/CHF projects a downside target around 0.7930, and the pair looks poised to break below its April low and the key 0.80 handle. Even if we see a short-term bounce, the broader trend structure on the daily chart remains bearish, favouring a move lower.
Economic Events in Focus (AEST / GMT+10)
09:50 JPY Foreign Bonds Buying, Foreign Investments in Japanese Stocks (USD/JPY, Nikkei 225)
16:00 EUR GfK German Consumer Climate (Jul) (EUR/USD, DAX)
18:30 GBP BoE Breeden Speaks (GBP/USD, FTSE 100)
20:00 EUR EU Leaders Summit (EUR/USD, DAX)
21:00 GBP BoE Gov Bailey Speaks (GBP/USD, FTSE 100)
21:00 EUR ECB's Schnabel Speaks (EUR/USD, DAX)
22:00 USD FOMC Member Barkin Speaks (USD, S&P 500, Nasdaq 100, Dow Jones, Gold, Crude Oil)
22:30 USD GDP, Core PCE Prices, Consumer Spending (Q1), Goods Trade Balance (May), Core Durable Goods Orders (May), Jobless Claims (USD, S&P 500, Nasdaq 100, Dow Jones, Gold, Crude Oil)
22:30 CAD Average Weekly Earnings (Apr), Wholesale Sales (May) (USD/CAD, TSX)
22:45 USD FOMC Member Barkin Speaks (USD, S&P 500, Nasdaq 100, Dow Jones)
00:00 USD Pending Home Sales (May), Pending Home Sales Index (May) (USD, S&P 500, Nasdaq 100, Dow Jones)
00:30 USD Natural Gas Storage (USD, Crude Oil)
02:00 USD 7-Year Note Auction (USD, Treasury Market)
View the full economic calendar
-- Written by Matt Simpson
Follow Matt on Twitter @cLeverEdge
How to trade with City Index
You can trade with City Index by following these four easy steps:
- Open an account, or log in if you’re already a customer
• Open an account in the UK
• Open an account in Australia
• Open an account in Singapore
- Search for the market you want to trade in our award-winning platform
- Choose your position and size, and your stop and limit levels
- Place the trade