


Euro Technical Forecast: EUR/USD Weekly Trade Levels
- EUR/USD remains capped below a key resistance zone after multiple failed breakout attempts
- Price continues to consolidate, signaling building pressure within the range
- A breakout above resistance would suggest a broader recovery is underway while a move lower would shift focus back to resumption of the broader decline
- Resistance 1.1598/1.1610 (key), 1.1747/75, 1.1917- Support 1.1355/94 (key), 1.1276, 1.1110/64
EUR/USD continues to trade within a tight range just below a critical resistance zone, with recent price action reflecting a period of consolidation following the sharp decline earlier this year. While the broader structure remains vulnerable below this barrier, the lack of follow-through to the downside suggests a potential inflection point may be forming. The focus now shifts to a breakout of this range, which could offer clearer guidance on the next directional move. Battle lines drawn on the EUR/USD weekly technical chart.
Euro Price Chart – EUR/USD Weekly
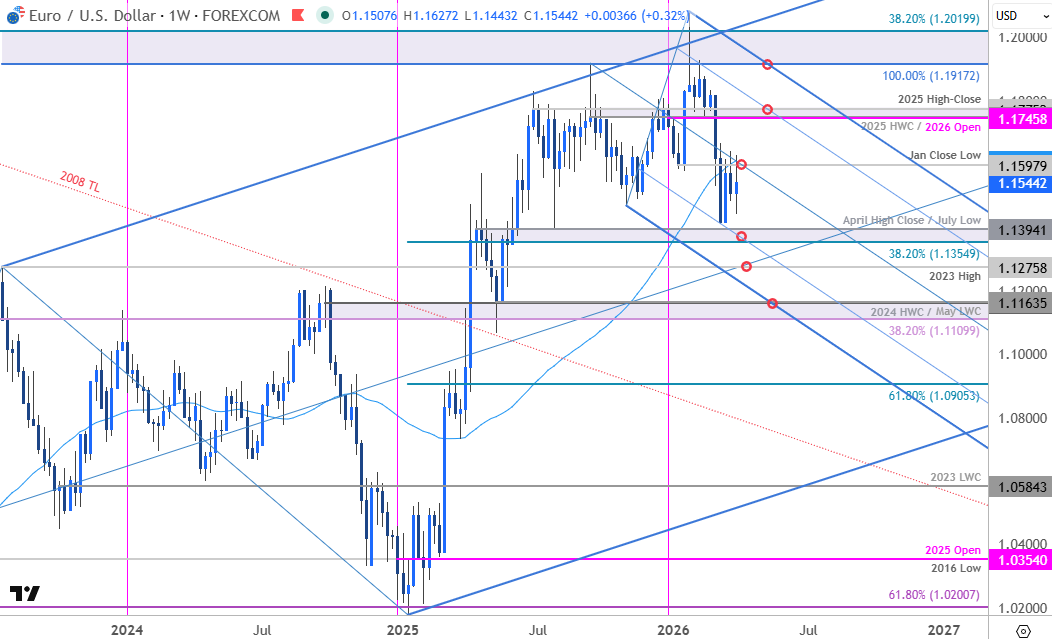
Chart Prepared by Michael Boutros, Sr. Technical Strategist; EUR/USD on TradingView
Technical Outlook: In last month’s Euro Technical Forecast we noted that EUR/USD had, “broken to seventh-month lows and threatens a larger correction within the multi-year uptrend. From a trading standpoint, rallies should be limited to 1.1598 IF price is heading lower on this stretch – look to reduce short-exposure / lower protective stops on a test of 1.1355/94. A close below this pivot zone would be needed to fuel the next major leg of the decline.” EUR/USD registered an intraday low at 1.1411 on that decline with the recovery failing to mark a weekly close above resistance for the past three-weeks.
Key weekly resistance remains at 1.1598/1.1610- a region defined by the January close low and the 52-week moving average. Note that the median-line converges on this zone over the next few weeks. The April opening-range is now taking shape just below- look for the breakout to offer guidance in the days ahead.
A topside breach above this slope would suggest a larger recovery is underway with the next major technical consideration eyed at the 2026 yearly open, the 2025 high-week close (HWC) and the 2025 high-close near 1.1745/75. The 61.8% parallel converges on this zone into the close of the month- look for a larger reaction there IF reached.
Key weekly support remains at 1.1355/94- a region defined by the 38.2% retracement of the 2025 advance, the April high close, and July swing low. The 61.8% slope line converges on this zone over the next few weeks and a break / weekly close below would be needed to fuel the next leg of the decline. Subsequent support objectives rest with the 2023 swing high at 1.1276 and 1.1110/64.

Bottom line: EUR/USD is in a range just below confluent resistance at the median-line - look for the breakout. From a trading standpoint, the risk remains weighted to the downside while below the yearly moving average with break below 1.1355 needed to threaten a fresh low.
Non-Farm Payrolls were released on Good Friday, and with the markets closed for the holiday the volatility risks are elevated into the Sunday open. There may be an increased potential for sharp moves or gaps on the reopen, especially with ongoing developments in the Iran conflict. Keep in mind we get key inflation updates next week, with the February Personal Consumption Expenditures (PCE) and the March Consumer Price Index on tap. The CPI print will be our first inflation update to include the sudden surge in oil prices. Traders should stay nimble into the monthly open and watch weekly closes closely for directional cues.
Review my latest Euro Short-term Outlook for a closer look at the near-term EUR/USD technical trade levels. Check out my latest Euro Q2 Outlook for a longer-term technical & fundamental breakdown.
Key Euro / US Economic Data Releases
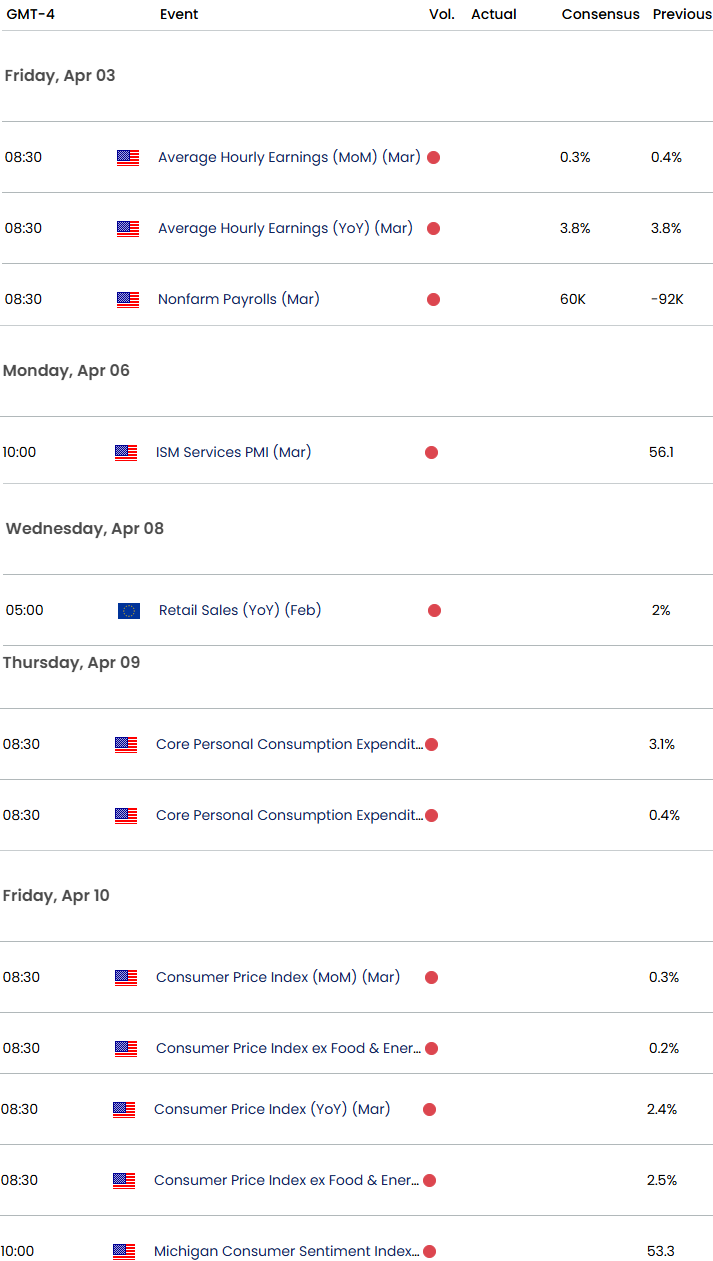
Economic Calendar - latest economic developments and upcoming event risk.
--- Written by Michael Boutros, Senior Technical Strategist
Follow Michael on X @MBForex


