Euro Technical Forecast: EUR/USD Weekly Trade Levels
- EUR/USD EUR/USD has fallen more than 5% from the yearly high, marking the largest weekly loss since April 2024.
- EUR/USD has fallen more than 5% from the yearly high, marking the largest weekly loss since April 2024.
- Price is now approaching a major support zone near 1.1355, where the next decisive reaction could determine whether the downtrend accelerates.
- Resistance 1.1497, 1.1571/98 (key), 1.1747/75- Support 1.1355/94, 1.1276 (key), 1.1164
The Euro has extended its sharp decline from the February highs, sending EUR/USD to its lowest levels in seven months and confirming a decisive shift in momentum. The breakdown below the 52-week moving average underscores the strength of the recent selloff threatens further losses for the single currency. Attention now turns to a pivotal support zone where the market will look for signs of stabilization. Whether buyers step in at this zone or the pair pushes lower will likely determine the next phase of the broader correction. Battle lines drawn on the EUR/USD monthly & weekly technical charts heading into the FOMC & ECB decisions next week.
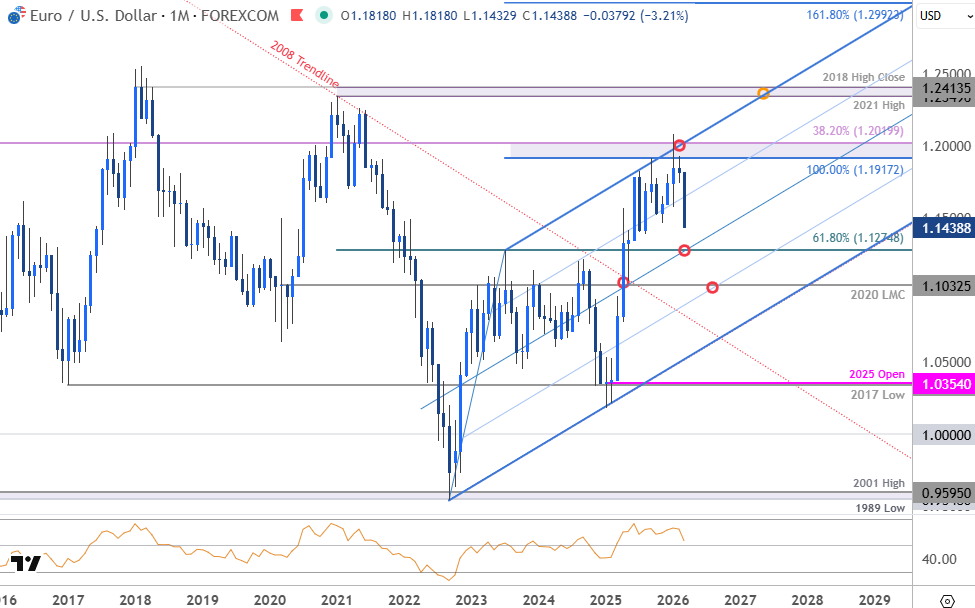
Euro Price Chart – EUR/USD Monthly
Euro Price Chart – EUR/USD Weekly
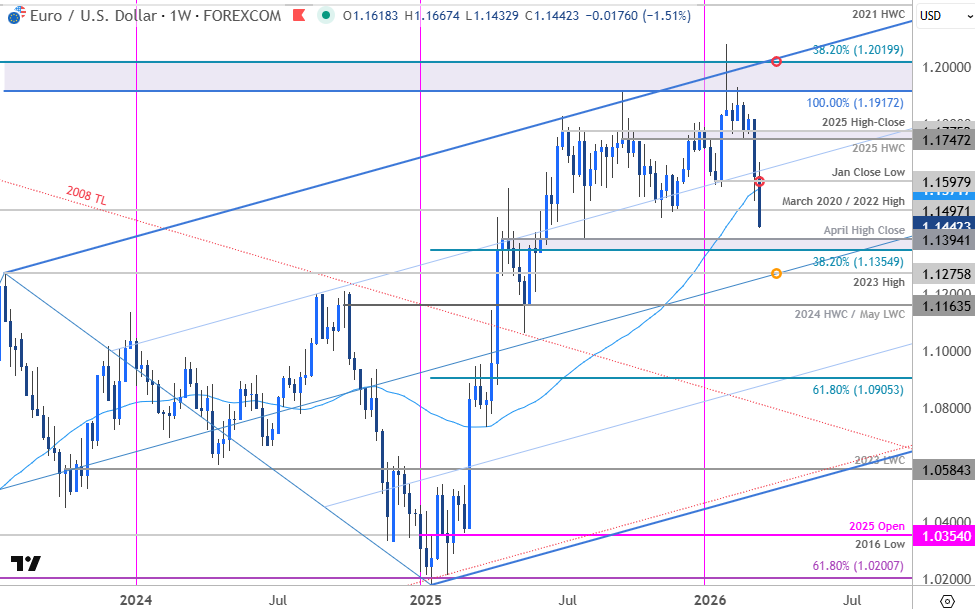
Chart Prepared by Michael Boutros, Sr. Technical Strategist; EUR/USD on TradingView
Technical Outlook: In last month’s Euro Technical Forecast we noted that EUR/USD was, “poised to snap a three-month advance with price trading just above pivotal support into the close of February. From a trading standpoint, the focus is on a breakout of the monthly opening-range (1.1746-1.1918) for guidance here. Ultimately, a larger pullback may offer more favorable opportunities closer to uptrend support..” A break below support into the March open has now extended more than 5.3% off the yearly highs with Euro marking the largest single-week loss since April of 2024.
The decline broke below the 52-week moving average this week with the next major support hurdle now in view at 1.1355/94- a region defined by the 38.2% retracement of the 2025 advance, the April high-close, and the July swing low. Look for a larger reaction there IF reached. Subsequent support rests with 2023 high which converges on the median-line near 1.1276 over the next few weeks. Losses below this slope would suggest that a more significant trend reversal is underway towards the 2024 high-week close (HWC) and the May low-week close (LWC) at 1.1164.
Initial resistance is now eyed with the March 2020 and 2022 swing highs at 1.1497 and is backed by the 52-week moving average / January low-close and the 1.1571/98. A breach and weekly close above this threshold would be needed to suggest a more significant low is in place. Ultimately the bulls would need to clear the 2025 high-week close (HWC) / high-close at 1.1747/75 to reassert control here.

Bottom line: A reversal off uptrend resistance in January has now broken to seventh-month lows and threatens a larger correction within the multi-year uptrend. From a trading standpoint, rallies should be limited to 1.1598 IF price is heading lower on this stretch – look to reduce short-exposure / lower protective stops on a test of 1.1355/94. A close below this pivot zone would be needed to fuel the next major leg of the decline.
Keep in mind that the Federal Reserve and European Central Bank interest rate decisions are scheduled for next week. While both central banks are widely expected to leave policy unchanged, the focus will turn to the Fed’s updated Summary of Economic Projections, particularly the outlook for growth, employment, and inflation. With the recent surge in oil prices raising concerns about inflation, the Committee may be less inclined to pursue further easing despite signs of softening in the labor market.
Fed Fund Futures
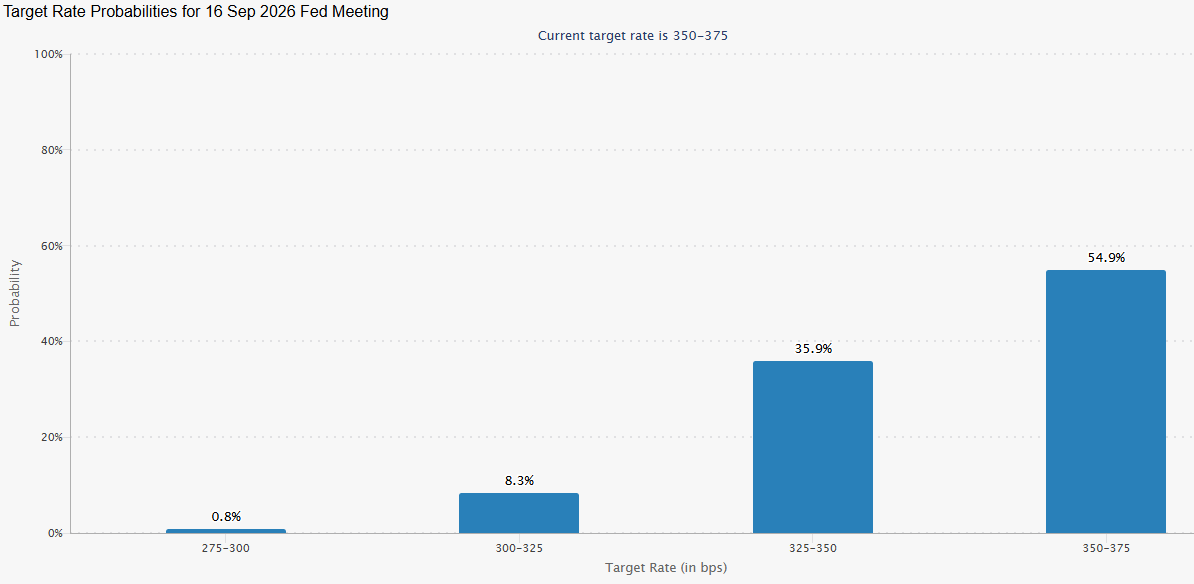
Source: CME
Markets have continued to reprice the expected timing of the next Fed rate cut, with September now implying only a 45% probability of easing. This represents a meaningful repricing from pre-war expectations that favored a July move. The US Dollar has benefited from the adjustment, and the focus next week will be on the Fed’s updated dot plot as investors gauge the Committee’s appetite for policy easing amid the evolving geopolitical backdrop. Keep your eyes on the headlines coming out of Iran and watch the weekly closes here for guidance. Review my latest Euro Short-term Outlook for a closer look at the near-term EUR/USD technical trade levels.
Key Euro / US Economic Data Releases
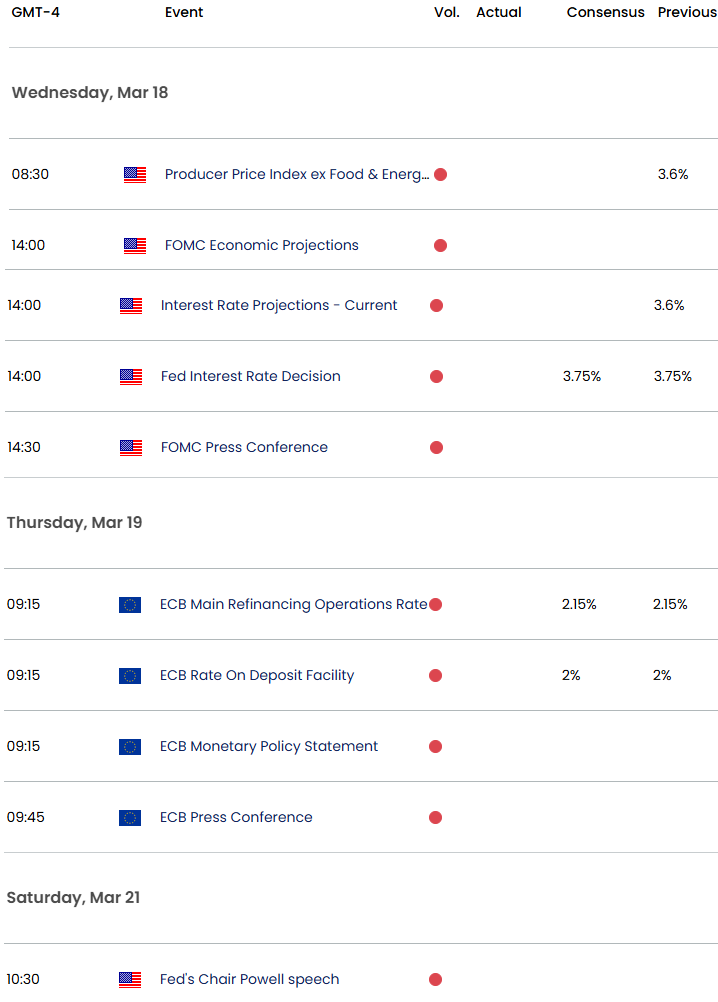
Economic Calendar - latest economic developments and upcoming event risk.
--- Written by Michael Boutros, Senior Technical Strategist
Follow Michael on X @MBForex