

Key Events
• EURUSD pulls back below 1.19 on a 7-month high NFP print
• DXY challenges a multi-year trendline, keeping currency markets and precious metals on edge
• Energy prices tilt to the upside, potentially reinforcing rate hold policies should inflation risks resurface
Energy prices tilting higher are reviving inflationary concerns, driven by cyclical rotations out of AI sectors and persistent US-Iran tensions keeping crude oil on a bullish edge near the 66 zone. This level remains a defining barrier between another pullback or a longer-term breakout toward the 70s once again.
This upside tilt in energy is bringing inflation risks back into focus across major economies. Lagarde noted in the latest policy hold that the ECB remains data-dependent, while the relative strength of the euro offers a degree of protection against external uncertainty.

EURUSD managed to climb above the 1.19 mark in an attempt to extend toward the 1.20 zone. However, the move reversed after NFP results exceeded expectations, printing a positive change of 130k, a 7-month high, reinforcing Fed rate hold expectations. The release stabilized the DXY above its 18-year trendline and pressured EURUSD below its 8-month trendline. Attention now shifts to the upcoming US CPI results, which may define the next breakout from current consolidation ranges.
Technical Analysis: Quantifying Uncertainties
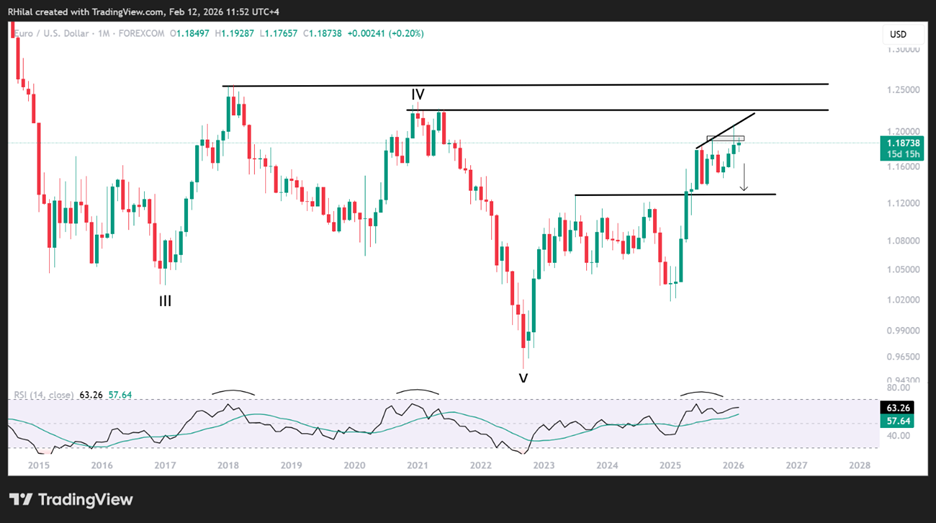
EURUSD Outlook: Monthly Time Frame – Log Scale
Source: Trading view
From a monthly perspective, EURUSD’s bullish bias is challenging a trendline connecting higher highs since July 2025, with the latest spike reaching 1.2080 and a monthly close near 1.1850.
Given the broader fundamental backdrop and the potential for dollar strength to hold, unless a clear daily or weekly close above 1.1950 emerges, EURUSD may face renewed selling pressure toward 1.1760 and 1.1580 before a deeper drawdown toward the 1.12 zone unfolds.
The monthly RSI is hovering at overbought levels last seen in 2021 and 2018, increasing the risk of a corrective move should the 1.180–1.1760 zone give way.
On the upside, a sustained close above 1.1950 would target highs last seen in 2021 and 2018 at 1.23 and 1.25, respectively.
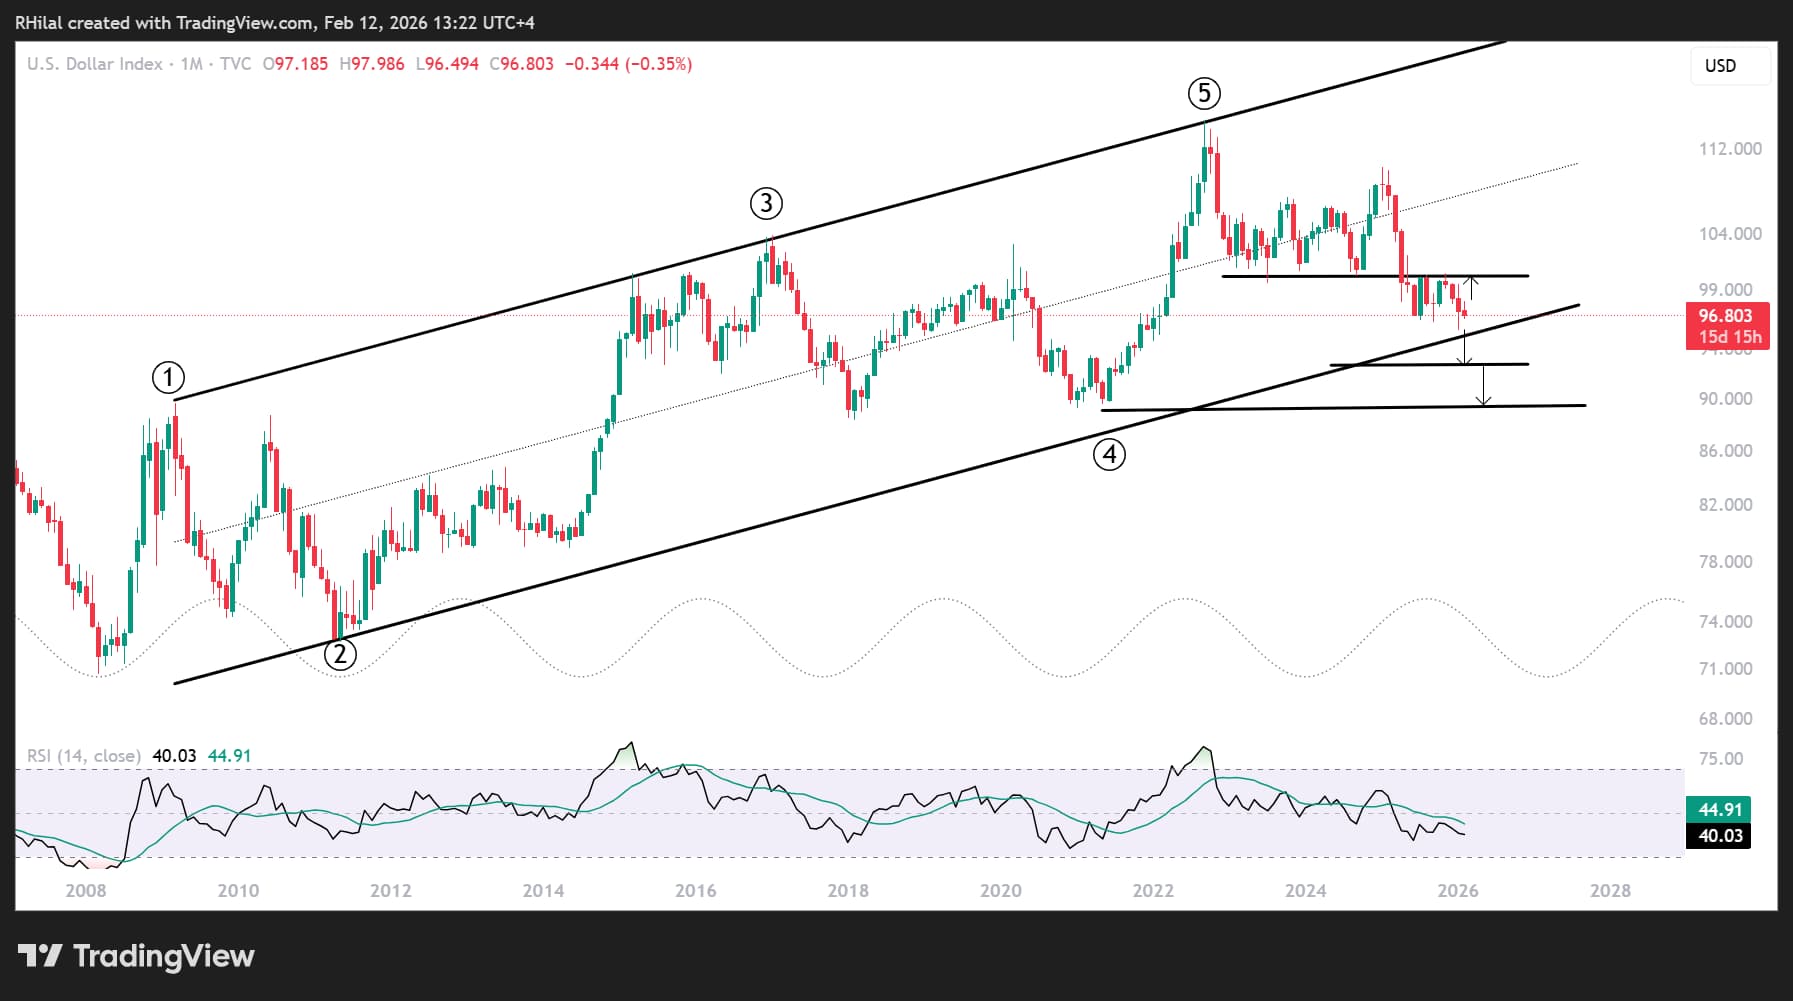
The chart that remains in focus is the DXY, holding above its multi-year trendline, defining either a structural shift in the 18-year cycle below the 95 mark or a continuation of the broader bullish structure.
DXY Outlook: Monthly Time Frame – Log Scale
Source: Trading view
Written by Razan Hilal, CMT
Follow on X: @Rh_waves