
April Forex Seasonality Key Points
- Geopolitical developments in Iran remain the dominant theme for traders, potentially overshadowing April’s FX seasonal trends.
- GBP/USD has, on average, seen its best performance in April, with average returns of around +0.6% since 1971
- For AUD/USD, de-escalation in the Middle East and a path toward a ceasefire would align with the bearish technical and seasonal perspective, presenting an interesting setup if that’s indeed how the situation evolves.
The beginning of a new month marks a good opportunity to review the seasonal patterns that have influenced the forex market over the 50+ years since the Bretton Woods system was dismantled in 1971, ushering in the modern foreign exchange market.
As always, these seasonal tendencies are just historical averages, and any individual month or year may vary from the historic average, so it’s important to complement these seasonal leans with alternative forms of analysis to create a long-term successful trading strategy. In other words, past performance is not necessarily indicative of future results.
Euro Forex Seasonality – EUR/USD Chart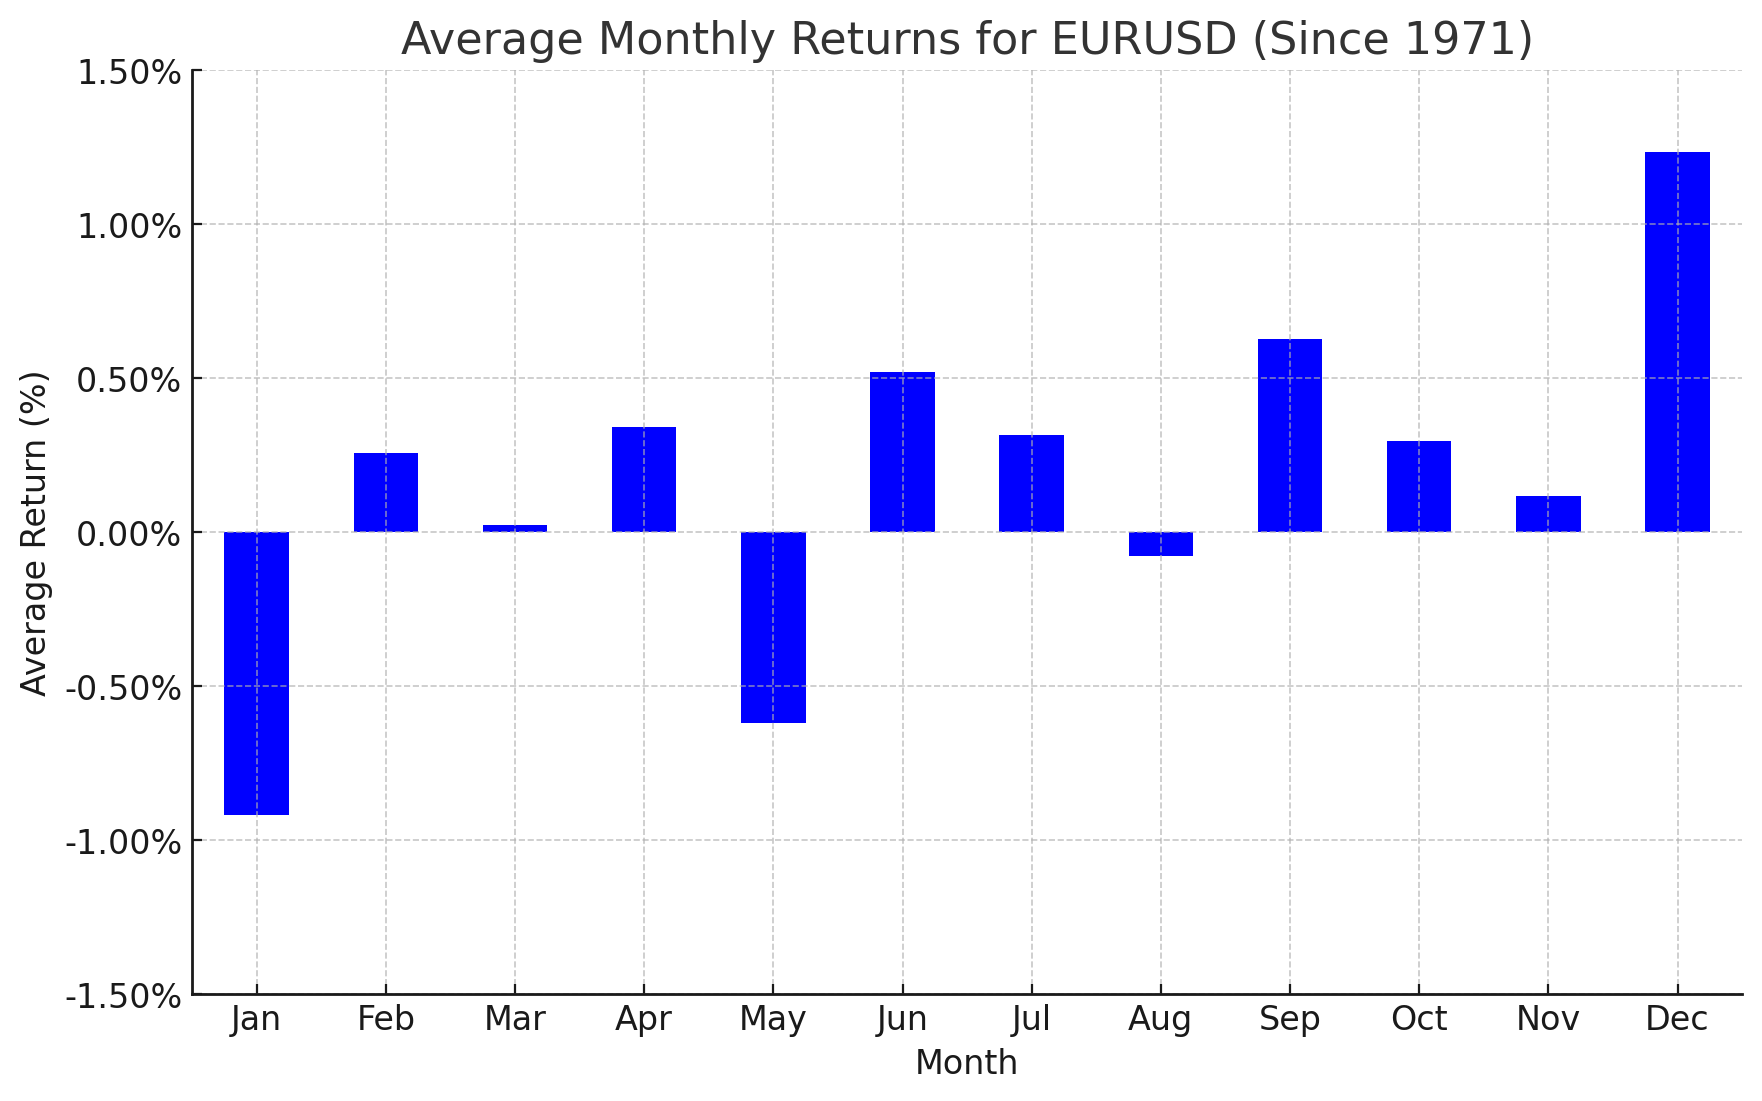
Source: TradingView, StoneX. Please note that past performance is not necessarily indicative of future results.
Historically, April has been a modestly positive month for EUR/USD, with the world’s most widely-traded currency pair sporting an average return of +0.3% over the last 50+ years. In March, EUR/USD fell amidst safe haven buying of the US dollar (a common theme throughout the month) and spiking energy prices amidst the conflict in Iran, overwhelming any seasonal tendency. While a recovery is possible this month, it may require tangible progress toward de-escalation in the Middle East before traders are comfortable selling dollars to any meaningful extent.
British Pound Forex Seasonality – GBP/USD Chart
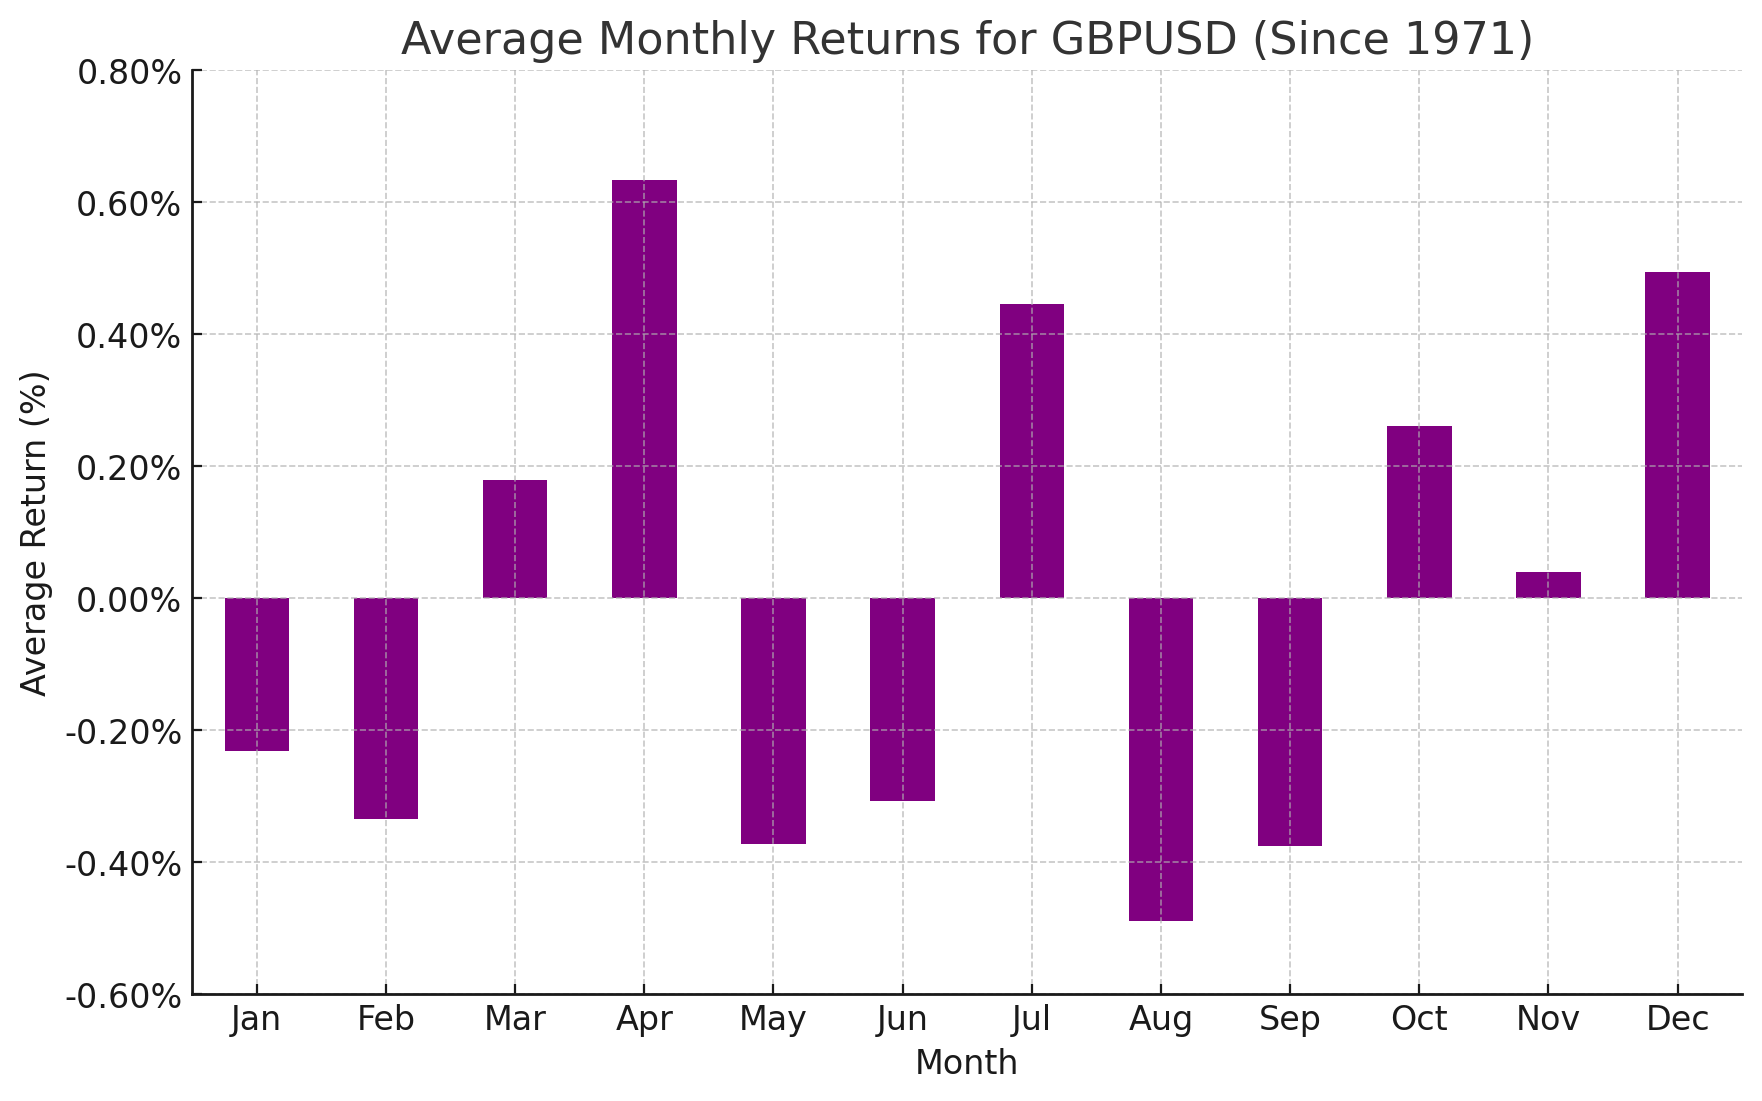
Source: TradingView, StoneX. Please note that past performance is not necessarily indicative of future results.
Looking at the above chart, GBP/USD has, on average, seen its best performance in April, with average returns of around +0.6% since 1971. Like the euro, the British pound fell against the greenback in March, but it has thus far held key technical support from the 78.6% Fiboancci retracement of the November-January rally near 1.3200; if that level continues to hold as support, a more substantial bounce is possible in the latter half of the month.
Japanese Yen Forex Seasonality – USD/JPY Chart
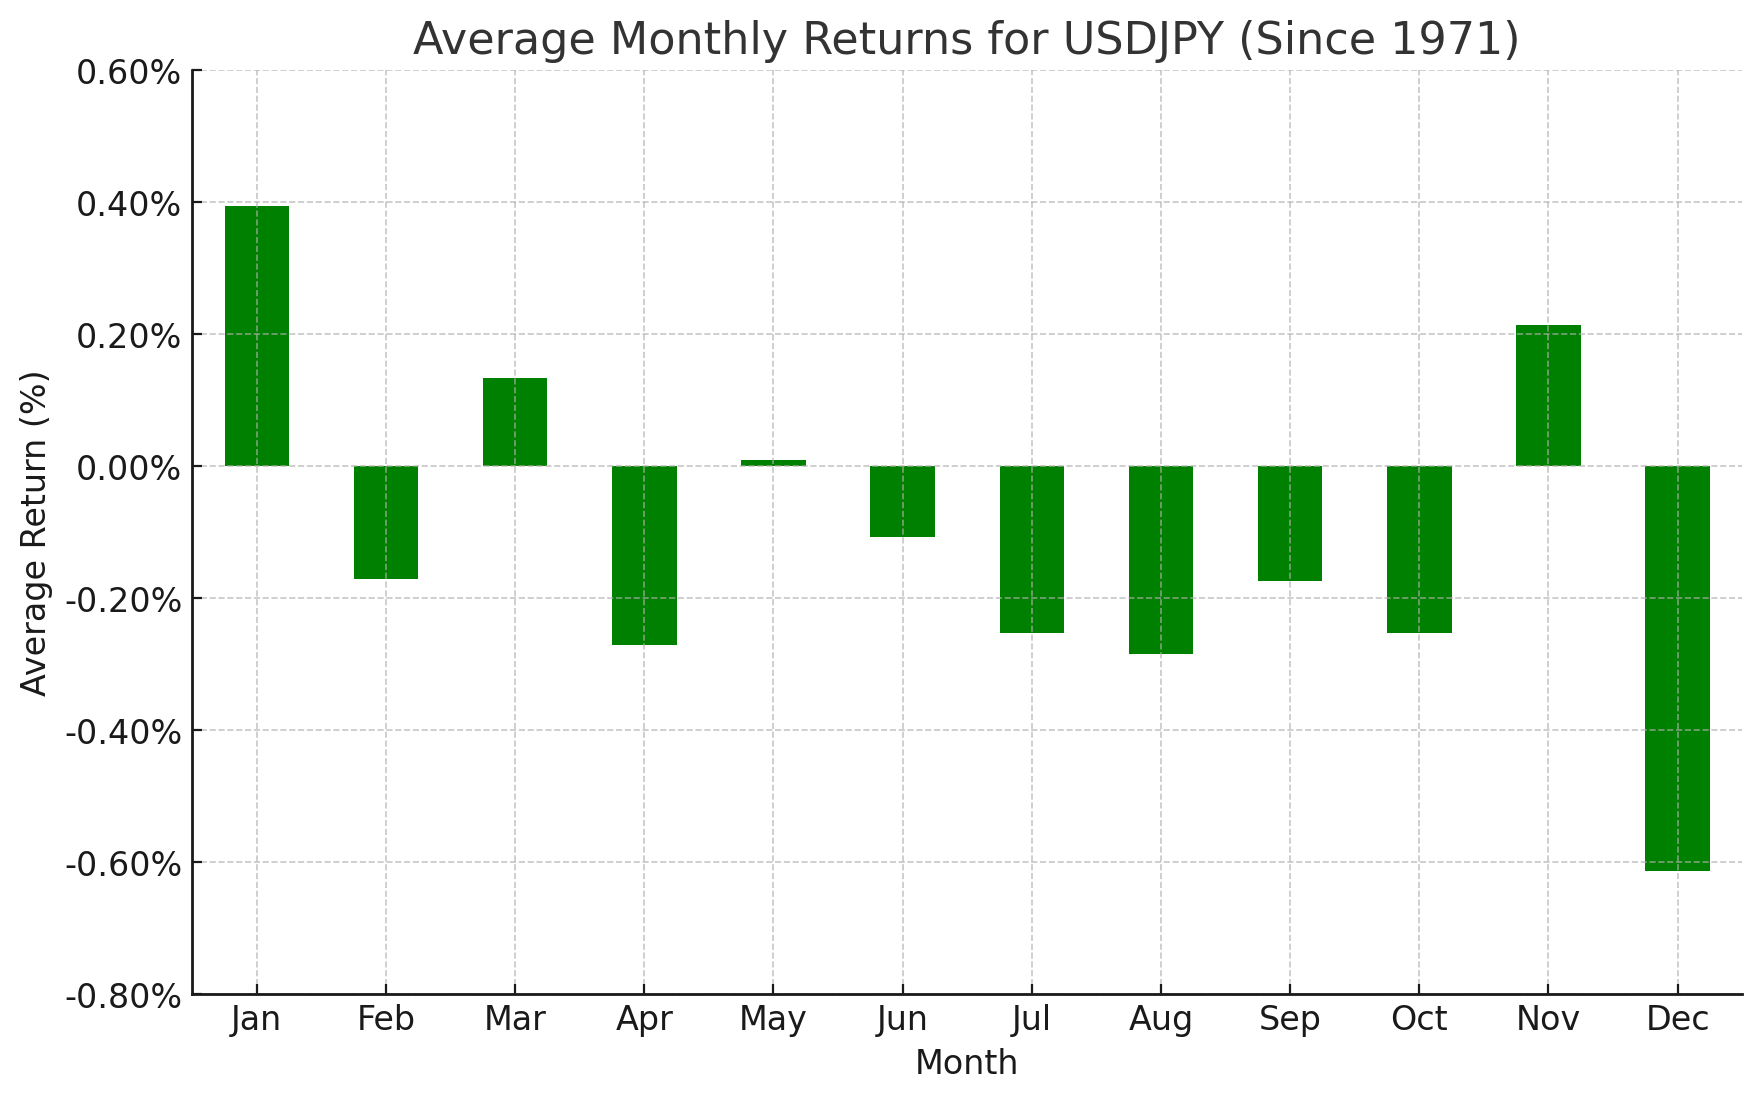
Source: TradingView, StoneX. Please note that past performance is not necessarily indicative of future results.
April has historically been a bearish month for USD/JPY, with the pair falling by an average of -0.2% since the Bretton Woods agreement. USD/JPY rose in line with its monthly tendency last month, though that was attributable to the country’s energy import dependence more than seasonality. Another bullish month, regardless of the specific catalyst, would put the pair solely in the intervention range above 160.00, putting pressure on Japanese authorities to stem the persistent weakness in the yen. Readers will note that we’ve already seen increasingly aggressive rhetoric on that front, something that could only accelerate from here.
Australian Dollar Forex Seasonality – AUD/USD Chart

Source: TradingView, StoneX. Please note that past performance is not necessarily indicative of future results.
Turning our attention Down Under, AUD/USD has historically traded higher in April, with an average gain of +0.4% going back to 1971. Last month, the Aussie fell in-line with the broader pullback in risk assets, although it arguably held up better than many expected. The situation in Iran will remain the ultimate arbiter of volatility in the pair in April, and previous-resistance-turned-support-turned-resistance-again at 0.6950 will be a key bull/bear level to watch as we start the month.
Canadian Dollar Forex Seasonality – USD/CAD Chart
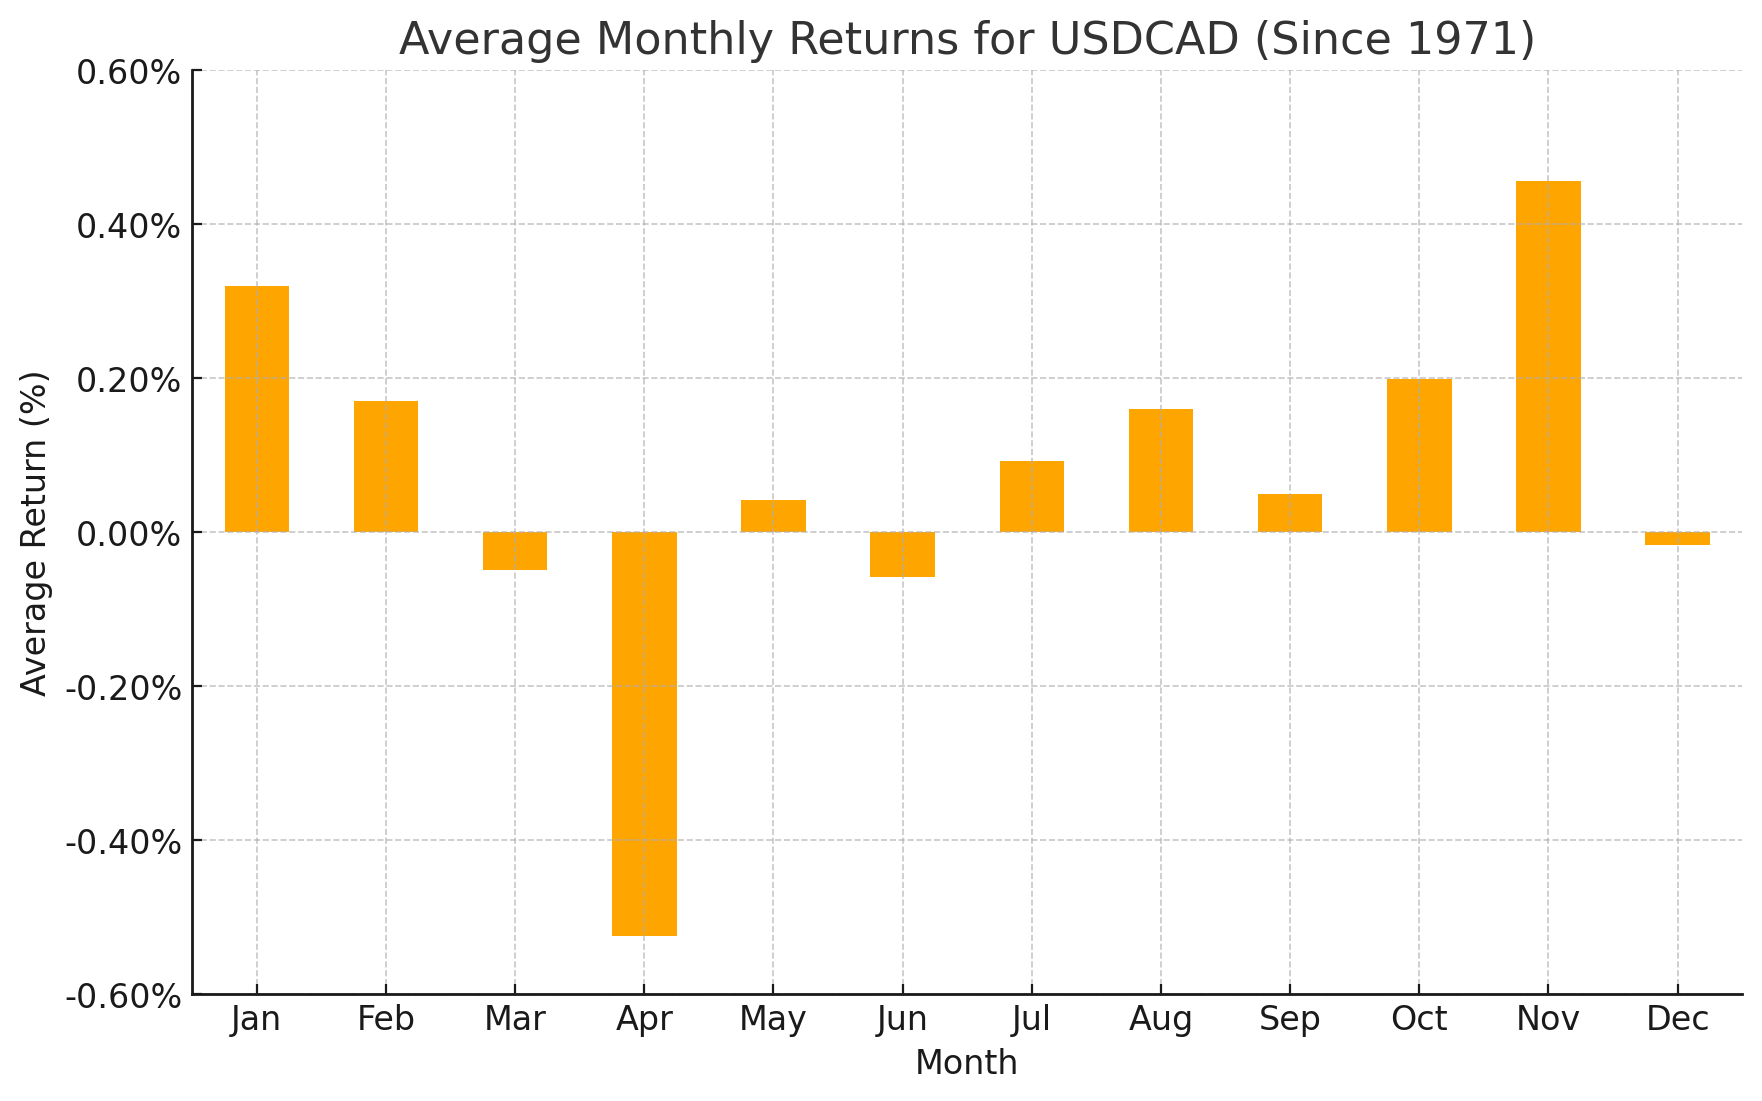
Source: TradingView, StoneX. Please note that past performance is not necessarily indicative of future results.
Last but not least, April has been the most bearish month for USD/CAD, with an average historical return of -0.5%. The North American pair surged in March on the back of the aforementioned safe haven demand for the US dollar, leaving rates just below the year-to-date high at 1.3935 as we go to press. De-escalation in the Middle East and a path toward a ceasefire would align with the bearish technical and seasonal perspective, presenting an interesting setup if that’s indeed how the situation evolves.
As always, we want to close this article by reminding readers that seasonal tendencies are not gospel – even if they’ve tracked relatively closely so far this year – so it’s important to complement this analysis with an examination of the current fundamental and technical backdrops for the major currency pairs.
-- Written by Matt Weller, Global Head of Research
Check out Matt’s Daily Market Update videos on YouTube and be sure to follow Matt on Twitter: @MWellerFX