


IMM data reveals stretched US dollar shorts alongside notable shifts in GBP, JPY and AUD futures. While headline positioning suggests deep dollar pessimism, underlying metrics show a more nuanced picture for FX traders navigating USD, GBP/USD, USD/JPY and AUD/USD.
View related analysis:
- Australian Dollar Outlook: Bullish Momentum Builds Above 70c
- FX Futures Positioning: USD, EUR, GBP, CAD | COT report
- AUD/JPY Outlook: Reversal Clues Threaten the Mighty Aussie Yen Trend
COT Report: FX Futures Positioning Across USD, GBP, JPY and AUD
Large Speculator Positioning from the COT report
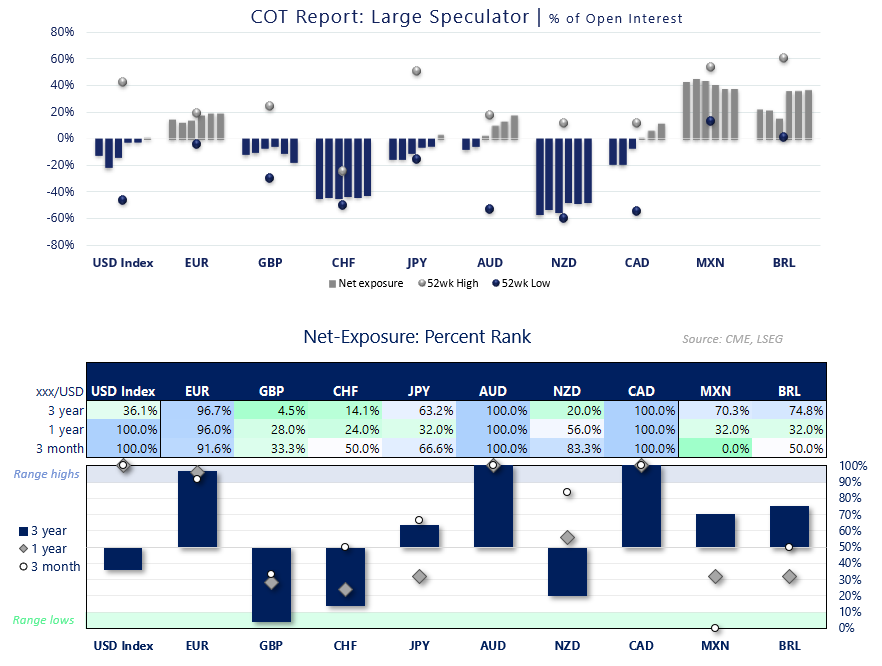
Source: CFTC (COT), LSEG
Futures traders effectively increased their net-short exposure to the dollar by $2.3 billion to -$22.8 billion — their most bearish level since March 2021. Despite this, large speculators flipped to net-long exposure on the US Dollar Index.
EUR/USD: Large speculators trimmed net-long exposure by -5.8k contracts with longs falling by -7.2k contracts and shorts down -1.3k
GBP/USD: Both large speculators and asset
USD/JPY: Large speculators flipped to net-long exposure
USD/CAD: Net-long exposure rose to a 3.5-year high among large speculators and a 4.5-year high among asset managers
AUD/USD: Asset managers flipped to net-long exposure, though only marginally at 1.7k contracts
NZD/USD: Asset managers trimmed net-short exposure to a 20-week low ahead of the RBNZ’s not-so-hawkish hold
Asset Manager Positioning | COT Report
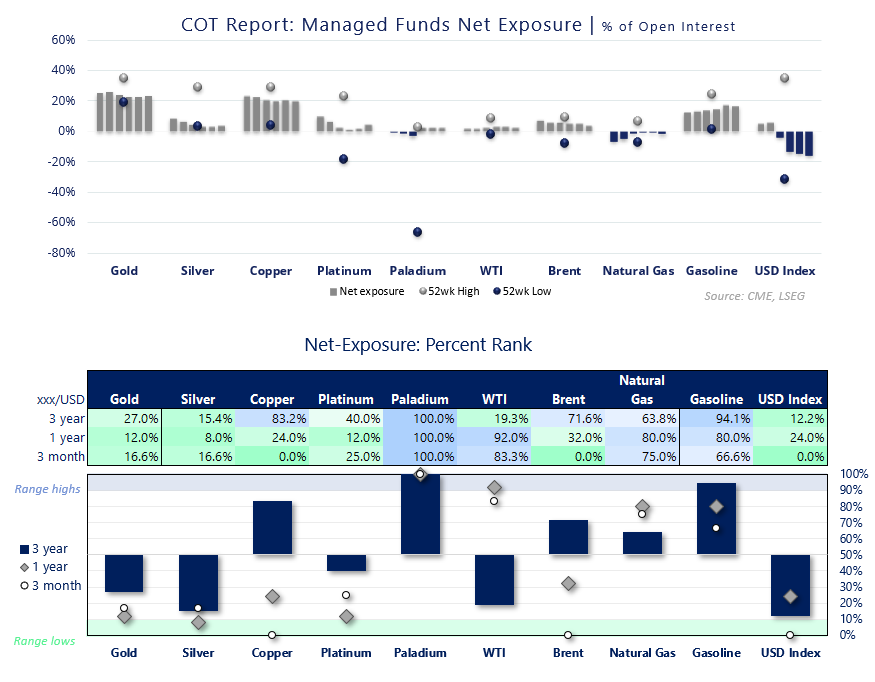
Source: CFTC (COT), LSEG

FX Futures Positioning | COT Report (IMM Data)
US Dollar Index (DXY) Futures Positioning | COT Report
We’re seeing a clear divergence of opinion on the US dollar, depending on the metric used. Large speculators flipped to net-long exposure in the USD index last week for the first time since June, while asset managers remained net-short for a fourth consecutive week.
However, when looking at aggregate positioning across futures markets, traders are net-short the US dollar by the most bearish amount since March 2021 — effectively a five-year extreme. With a false break around 96 near prior swing lows and sentiment stretched to bearish extremes, I continue to question whether the US dollar rebound has further upside potential.
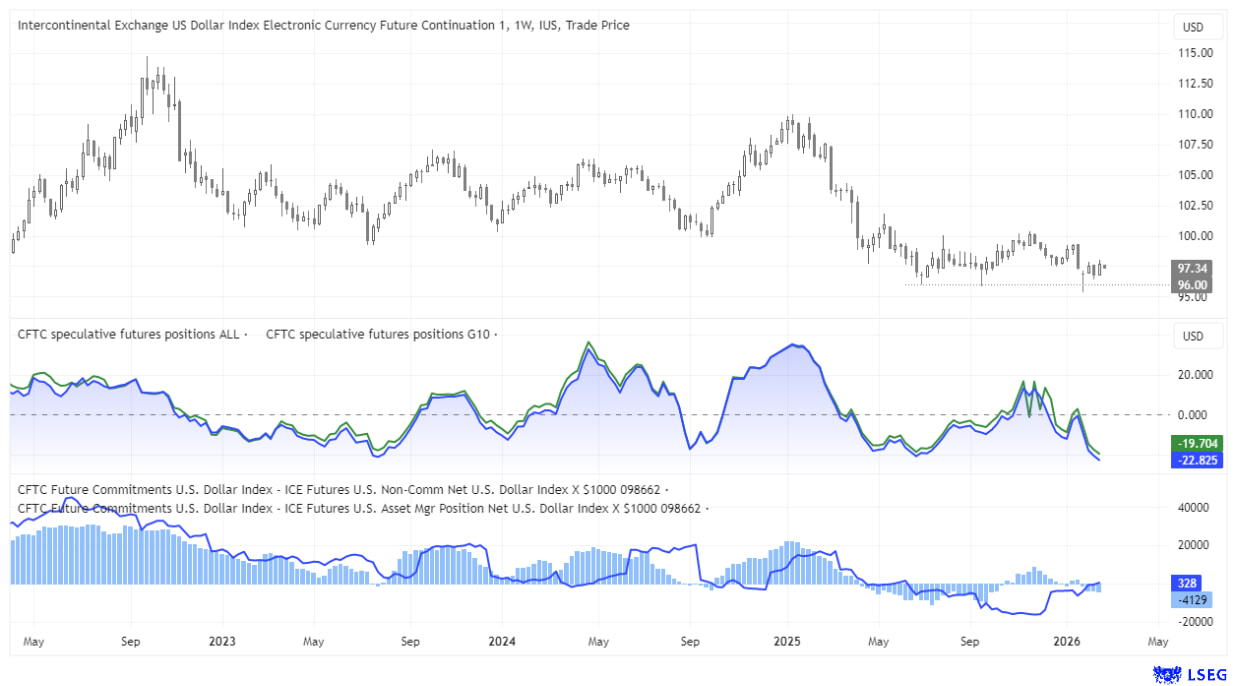
Source: CFTC (COT), LSEG
GBP/USD Futures Positioning | COT Report
We’re seeing a classic combination of bearish initiation alongside bullish capitulation on the British pound futures market. Net-long exposure rose to a nine-week high of 42.4k contracts among large speculators, and a 10-week high among asset managers.
Given last week’s bearish engulfing candle, negative sentiment towards pound and the potential for the US dollar to grind higher, GBP/USD could face further selling pressure in the weeks ahead.
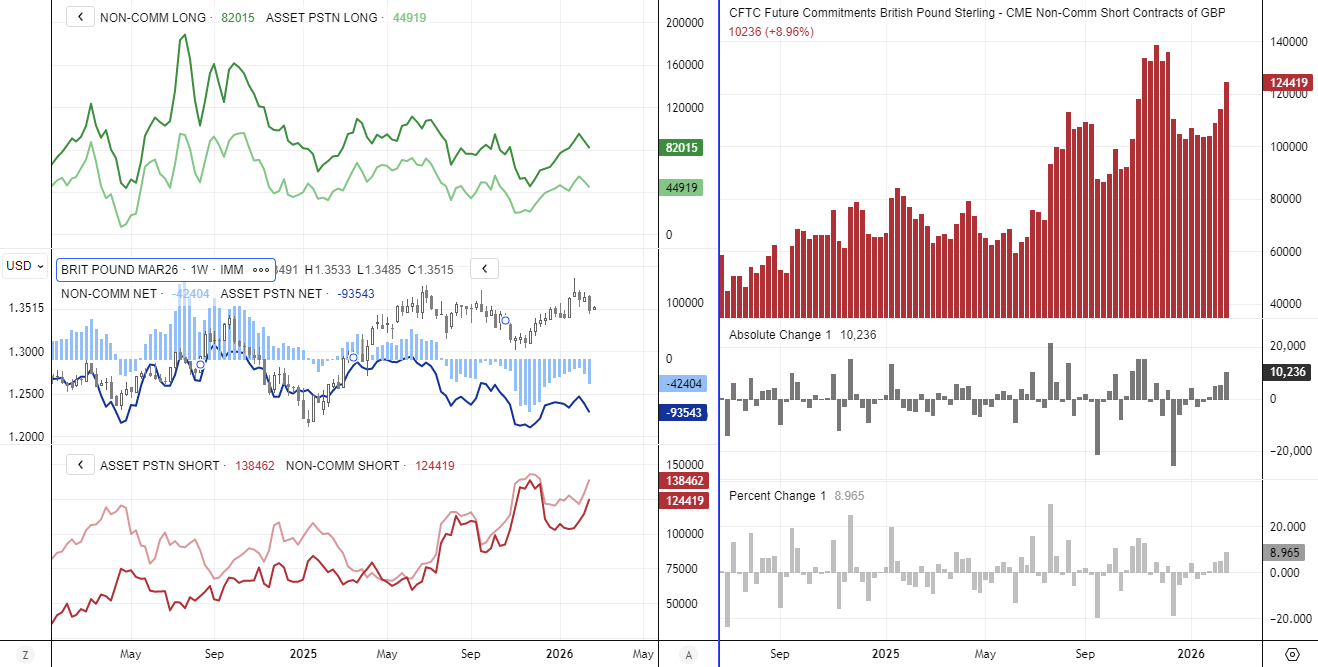
Source: CFTC (COT), LSEG

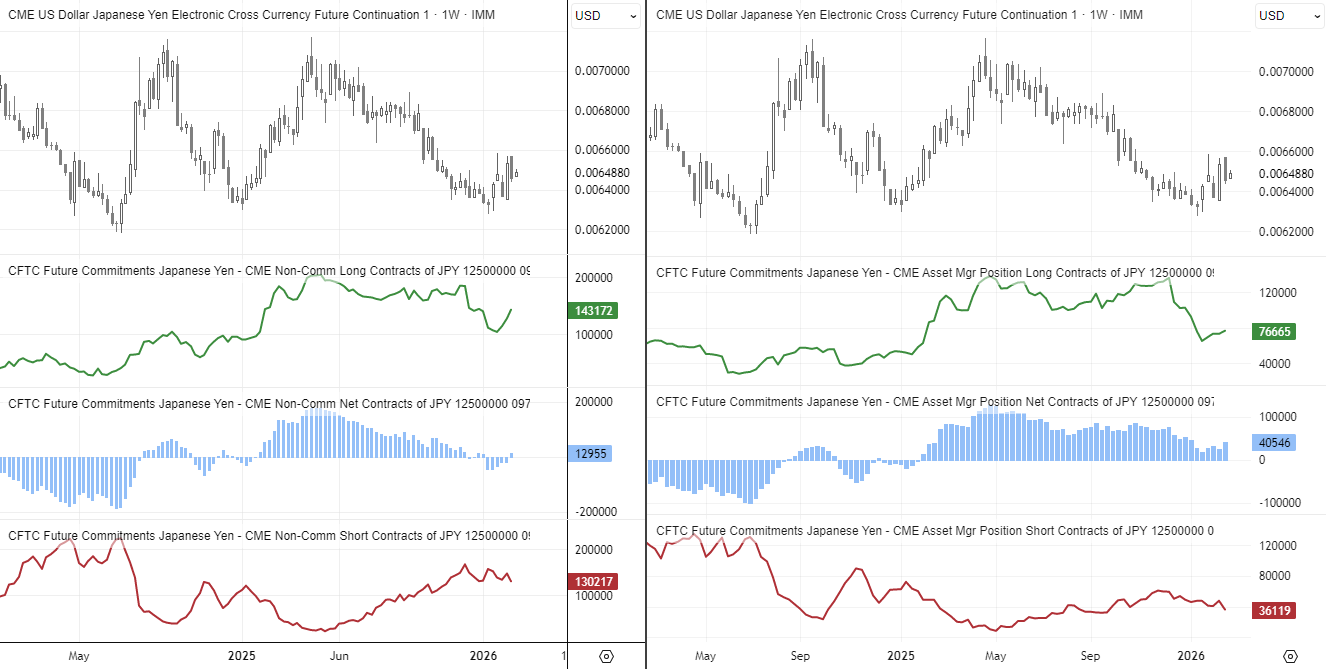
USD/JPY Futures Positioning | COT Report
Large speculators flipped to net-long exposure to Japanese yen futures last week, after a five-week hiatus as being net-short. Both sets of traders increased yen long bets and trimmed shorts.
Regardless, yen futures went on to close the week lower, but note that prices remain in the upper half of the prior week’s bullish engulfing candle. So perhaps the pullback on the yen could be limited, which means upside on USD/JPY could be capped.
Source: CFTC (COT), LSEG
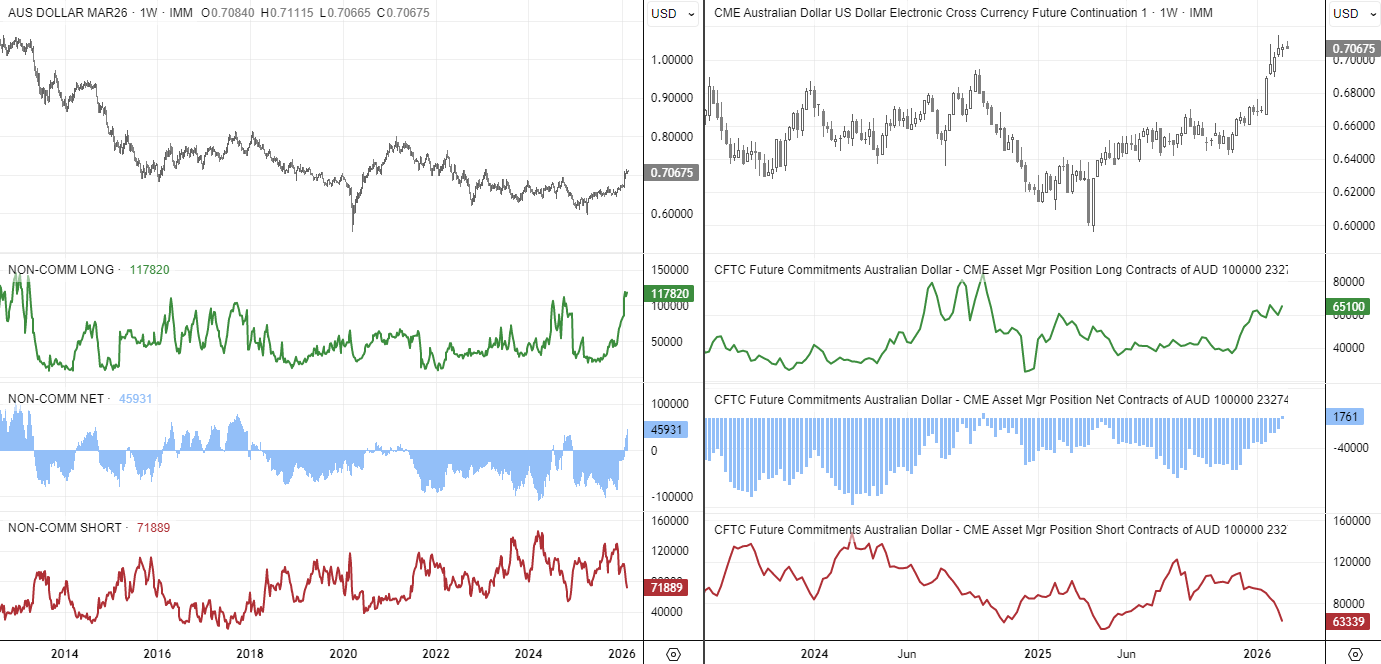
AUD/USD Futures Positioning | COT Report
Bulls continued to express confidence in Australian dollar futures last week, with asset managers flipping to net-long exposure for the first time since October. While it is only 1.7k contracts, shorts declined for an eighth consecutive week, falling by 10.4k contracts (14.1%) to a 40-week low.
Large speculators are their most bullish since October 2017, with gross longs at their highest level since March 2013. The influx of bullish bets may be hinting at a near-term sentiment extreme. However, with short positions dropping sharply among both groups of traders, it is difficult to envisage a deep pullback. A period of consolidation or a shallow retracement may be more likely for AUD/USD traders.
Source: CFTC (COT), LSEG


