
Sterling heads into the Bank of England decision at a critical juncture. While rates are expected to be held at 3.75%, the MPC vote split has become the primary risk for GBP pairs, with positioning stretched and technical signals flashing warning signs across both GBP/USD and EUR/GBP.
View related analysis:
- US Dollar Rebound Faces Crucial Test Ahead of ADP, ISM and NFP
- Nasdaq 100 Outlook: Earnings Strength Meets Technical Resistance
- FX Futures Positioning: USD Index, AUD/USD, USD/CAD | COT report
- Australian Dollar Outlook: AUD/USD, AUD/JPY, AUD/CAD Momentum Slows
BoE Vote Split in Focus as Sterling Tests Key Levels Across GBP Pairs
The Bank of England is expected to hold its policy rate at 3.75% today and maintain a cautious, data-dependent tone without committing to further cuts. The December decision to cut rates by 25bp was narrower than expected, passing 5–4, underscoring growing division within the MPC. For today’s meeting, estimates suggest a 7–2 vote in favour of holding, with only two members backing another cut.
While economists broadly pencil in one or two additional cuts later this year, market pricing is more restrained. The 1-year OIS implies around an 84% probability of just one cut, while the 3-month OIS prices only a ~20% chance, signalling little expectation of near-term action from the BoE. But given inflation remains above target and yields elevated, traders may want to be on guard for a slightly more dovish message than expected.
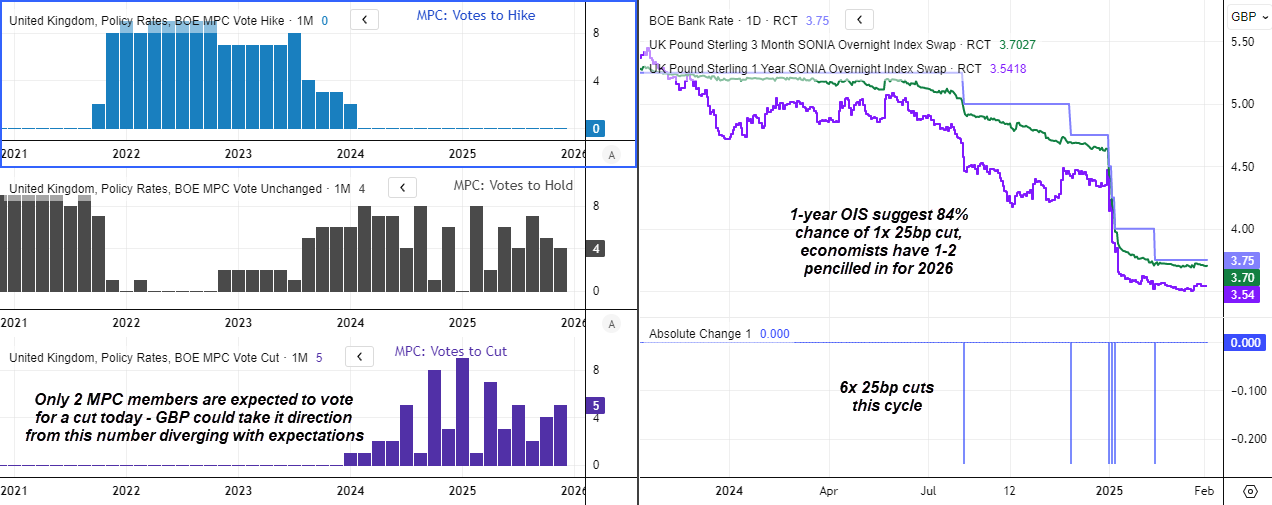
Source: BOE, MPC, LSEG
As a result, GBP could take its cue from any deviation in the vote split.
- Three or more votes for a cut would likely weigh on sterling by pulling forward expectations for the next easing step.
- One or fewer votes for a cut would be GBP-supportive, reinforcing the view that the BoE is in no hurry to resume easing and pushing rate-cut expectations further into the year.

GBP/USD Technical Analysis: British Pound vs US Dollar
GBP/USD Futures Positioning | COT Report
The weekly chart shows British pound bulls have enjoyed a solid rally from the November low, with GBP/USD futures rising around 6.5% to last week’s high. However, a shooting star candle warns of potential trend exhaustion and a false break above the 2022 and June highs. This could mark a pause in the trend or a minor pullback. A deeper retracement becomes more plausible if the BOE delivers a dovish surprise and Friday’s nonfarm payrolls beat expectations, allowing the US dollar to extend its rebound.
The latest Commitment of Traders (COT) data show large speculators (left chart) remain net-short GBP/USD futures, although at their least bearish level since mid-October. This coincides with a steady rise in gross long positions, though short-covering stalled around late December. As a result, positioning sits on a knife-edge between net-long and net-short exposure, leaving traders alert to either a bullish breakout above the June high or a retracement from current levels.
Asset managers (right chart) remain net-short GBP/USD futures by around 75.6k contracts. While long exposure has increased, it continues to lag shorts, suggesting limited conviction that the rally has much further to run.
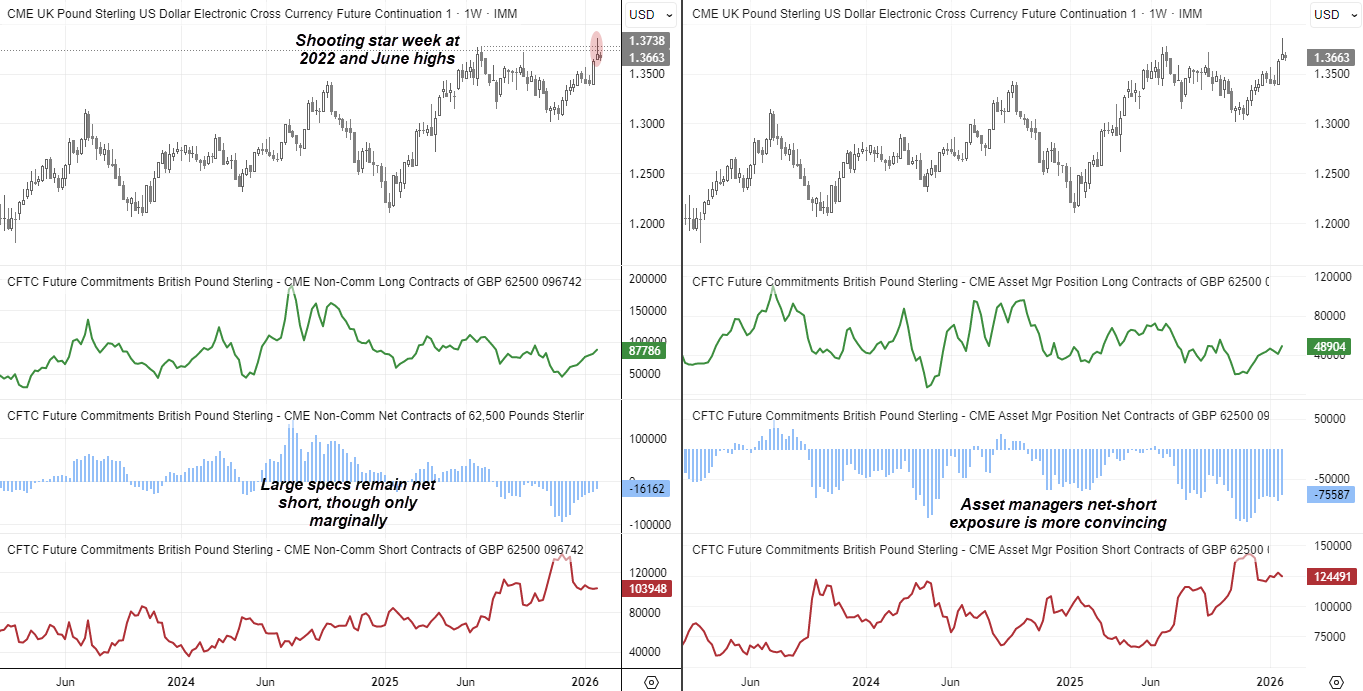
Source: CFTC, IMM, CME, LSEG
GBP/USD Daily Chart
The daily chart shows GBP/USD holding above the monthly pivot for now, although two hammer candles have formed with upper wicks rejecting the 2022 and July highs as resistance. A break below Monday’s low would also invalidate the monthly pivot and open the door to a deeper pullback.
The rally into the cycle high occurred on relatively light volume, while a clear high-volume node (HVN) sits near the 200-day SMA, just above the monthly S1 pivot. This zone stands out as a key decision area, where bulls may attempt to defend support and bears may look for trend continuation lower.
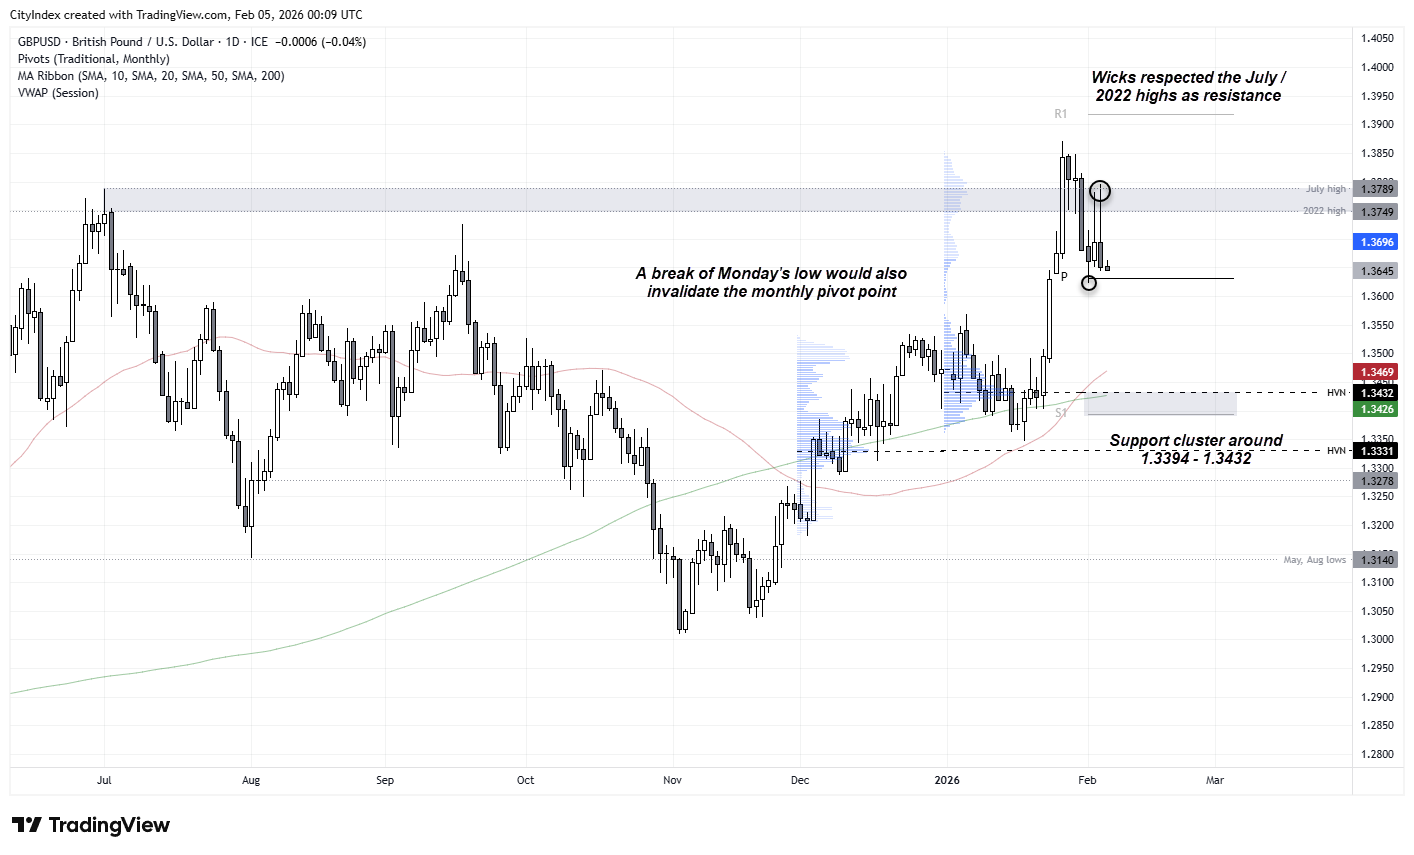
Source: TradingView, ICE

EUR/GBP Technical Analysis: Euro vs British Pound
Stepping back, EUR/GBP appears to be approaching a potential inflection point over the coming days or weeks. The cross has already fallen around 252 pips from the 2025 high, with 10 of the past 11 weekly candles closing lower, and it is on track to finish lower again this week. If prices were to close near current levels, the weekly candle would resemble a bullish hammer.
Weekly RSI (2) has remained oversold below 10 throughout the year and now sits at an extreme reading near 1, highlighting stretched downside momentum. On the daily chart, a bullish engulfing candle formed recently, signalling an attempt by buyers to regain control. While the 200-day SMA continues to cap rallies, a sustained break above it would mark a meaningful win for bulls.
A more dovish-than-expected BOE could act as a near-term catalyst for EUR/GBP to recover some ground. Even if the cross extends lower, the August 2025 low remains a significant technical level, where bearish profit-taking could emerge and naturally increase the risk of a rebound.
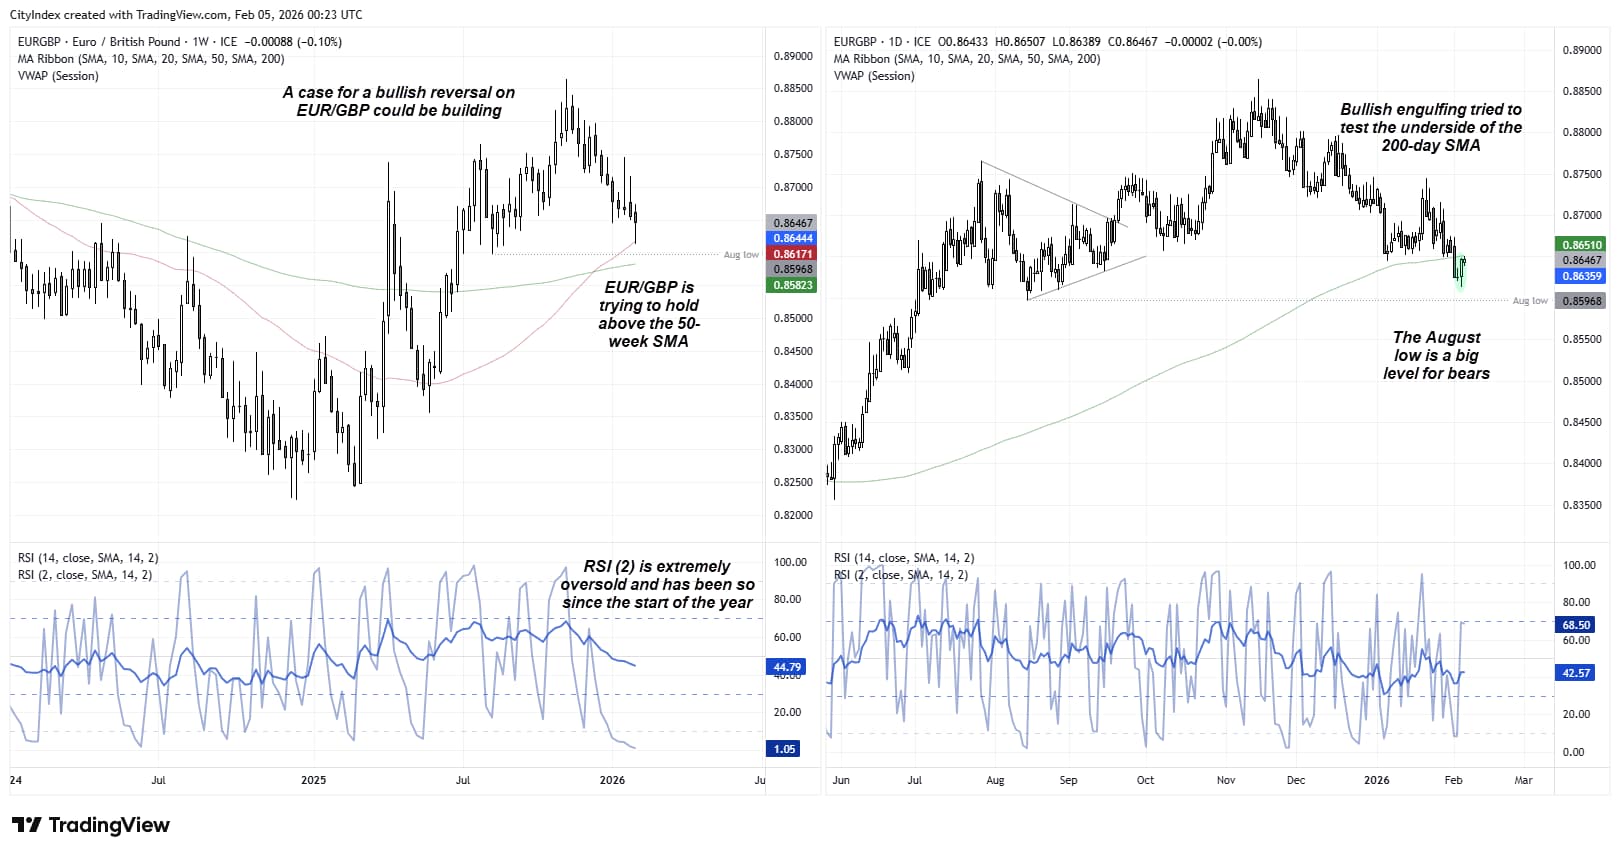
Source: TradingView, ICE
View the full economic calendar
-- Written by Matt Simpson
Follow Matt on Twitter @cLeverEdge
How to trade with City Index
You can trade with City Index by following these four easy steps:
- Open an account, or log in if you’re already a customer
• Open an account in the UK
• Open an account in Australia
• Open an account in Singapore
- Search for the market you want to trade in our award-winning platform
- Choose your position and size, and your stop and limit levels
- Place the trade