

Recent sessions have shown a notable lack of direction in gold price action in the short term. Over the past three sessions, the metal has moved only slightly above 2.00%, trading without a clear trend around the $4,500 per ounce level, reflecting a consistent phase of indecision in the market.
For now, the escalation of the Middle East conflict and the behavior of alternative assets have prevented demand for gold from stabilizing. In this context, indecision could remain a dominant factor in XAU/USD price action over the coming sessions.

Gold struggles to retain its appeal
Recent weeks have been marked by key central bank decisions and broader monetary policy dynamics. Institutions such as the Bank of Canada, the Federal Reserve, and the European Central Bank have largely adopted a hold stance, as they continue to assess inflation trends and external risks.
This environment has led to a rise in global bond yields. In the United States, 10-year yields are near 4.3%, in Canada around 3.5%, and in Europe close to 3.56%—levels not seen in some cases for several years, highlighting the growing appeal of fixed income markets.
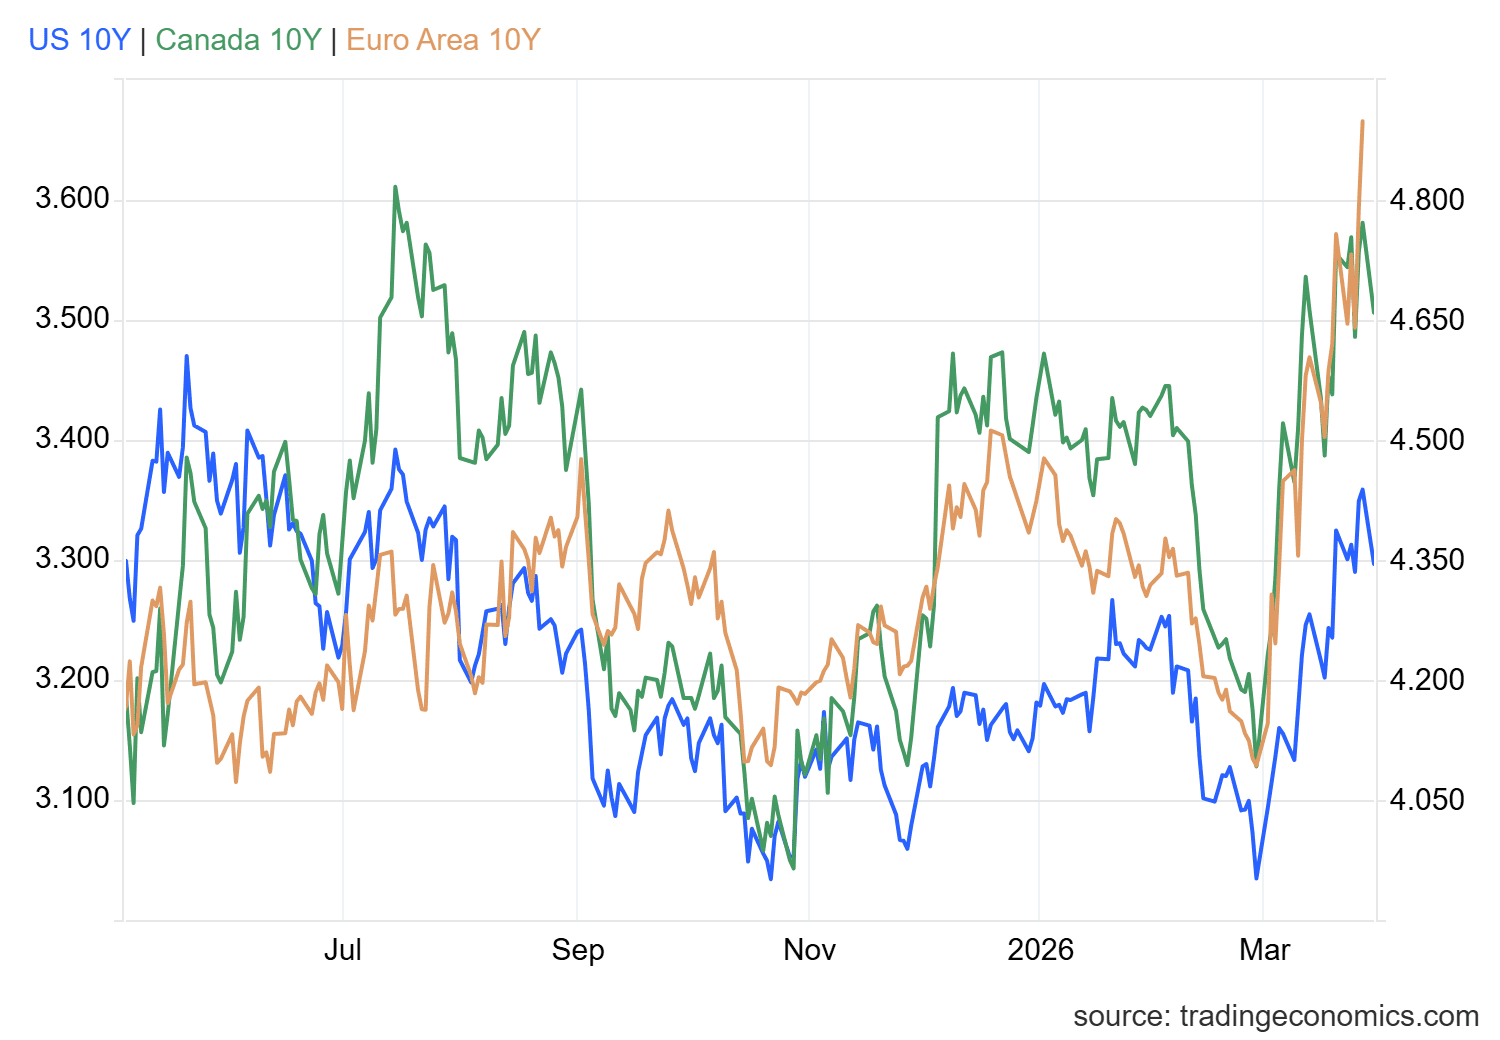
Source: TradingEconomics
It is important to note that the bond market is one of the main substitutes for gold, offering a more stable and yield-generating alternative. As yields have increased, the relative attractiveness of gold has declined.
In fact, capital flows into gold ETFs have shown consistent outflows since the week of March 6, totaling more than $4.3 billion by the week ending March 27. This confirms a loss of interest in gold as the market shifts toward other assets.
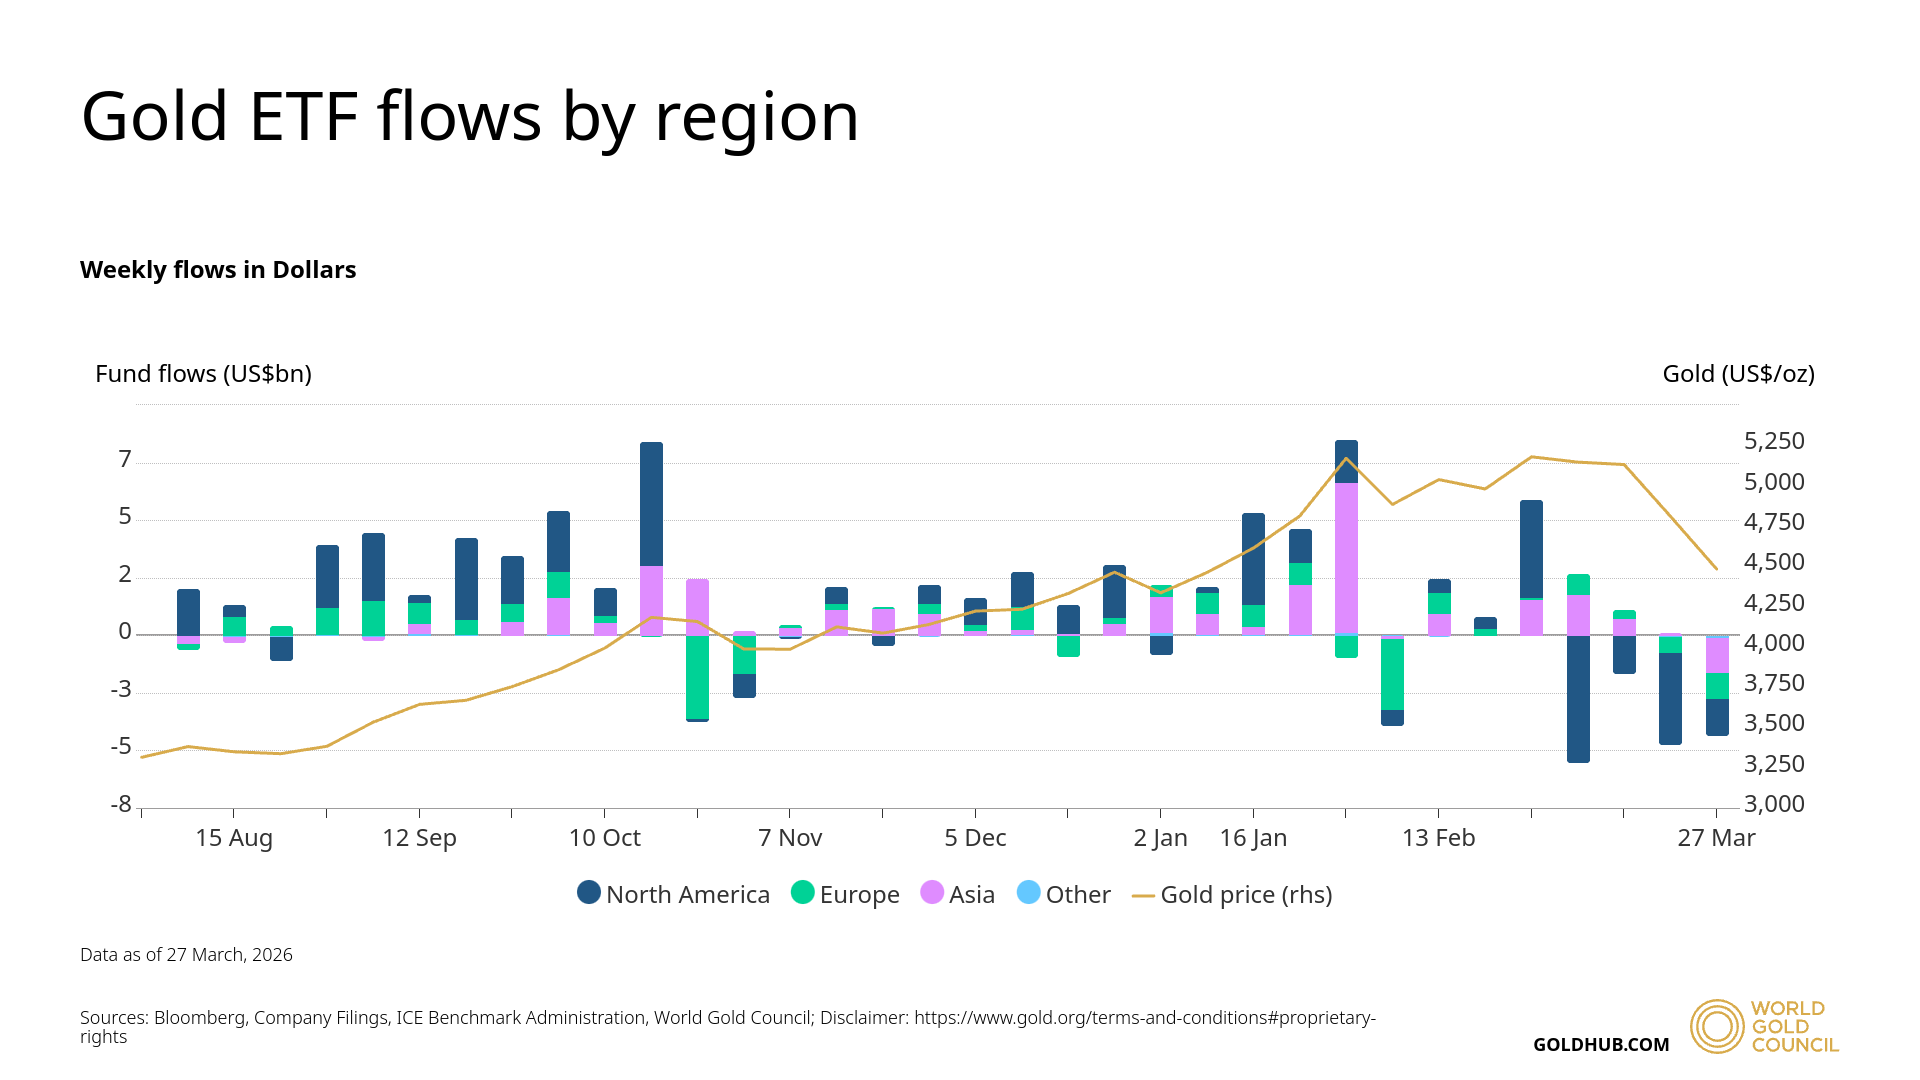
Source: GoldHub
In this context, as long as alternative assets continue to offer stronger returns or relative appeal, gold may continue to lose traction. This dynamic could sustain a weak or indecisive environment in XAU/USD in the coming sessions.
Confidence dynamics no longer favor gold
Recent developments in the Middle East conflict suggest that a short-term resolution remains unlikely. Statements from former President Trump regarding potential action against Iranian energy infrastructure, along with concerns from the G7 about the impact on global energy markets, have increased uncertainty.
This has been reflected in market sentiment indicators such as the Fear and Greed Index, which has dropped to around 9 points, entering “extreme fear” territory and reaching levels not seen since November 2025.
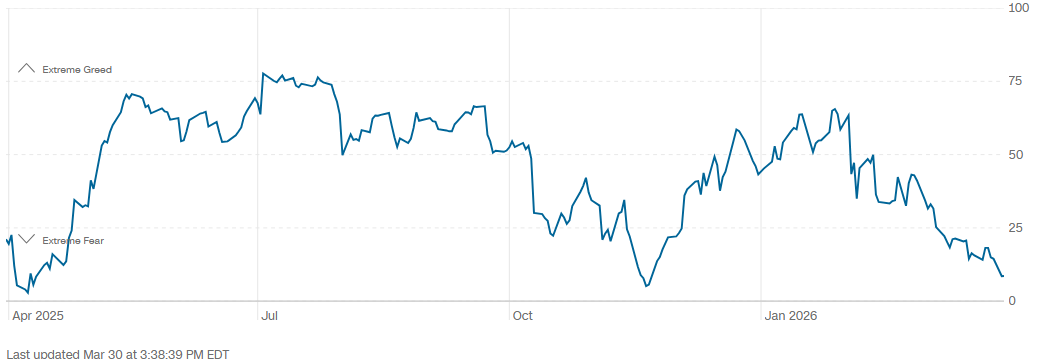
Source: CNN
However, despite the decline in confidence, gold has not benefited from this environment as it typically would. This suggests that the market is not currently viewing gold as the primary safe-haven asset, instead favoring alternatives such as the U.S. dollar.
If this dynamic continues, the neutral behavior in gold could remain a dominant feature in the short term, as a lack of consistent activity becomes more evident in price movements.
Gold Technical Outlook
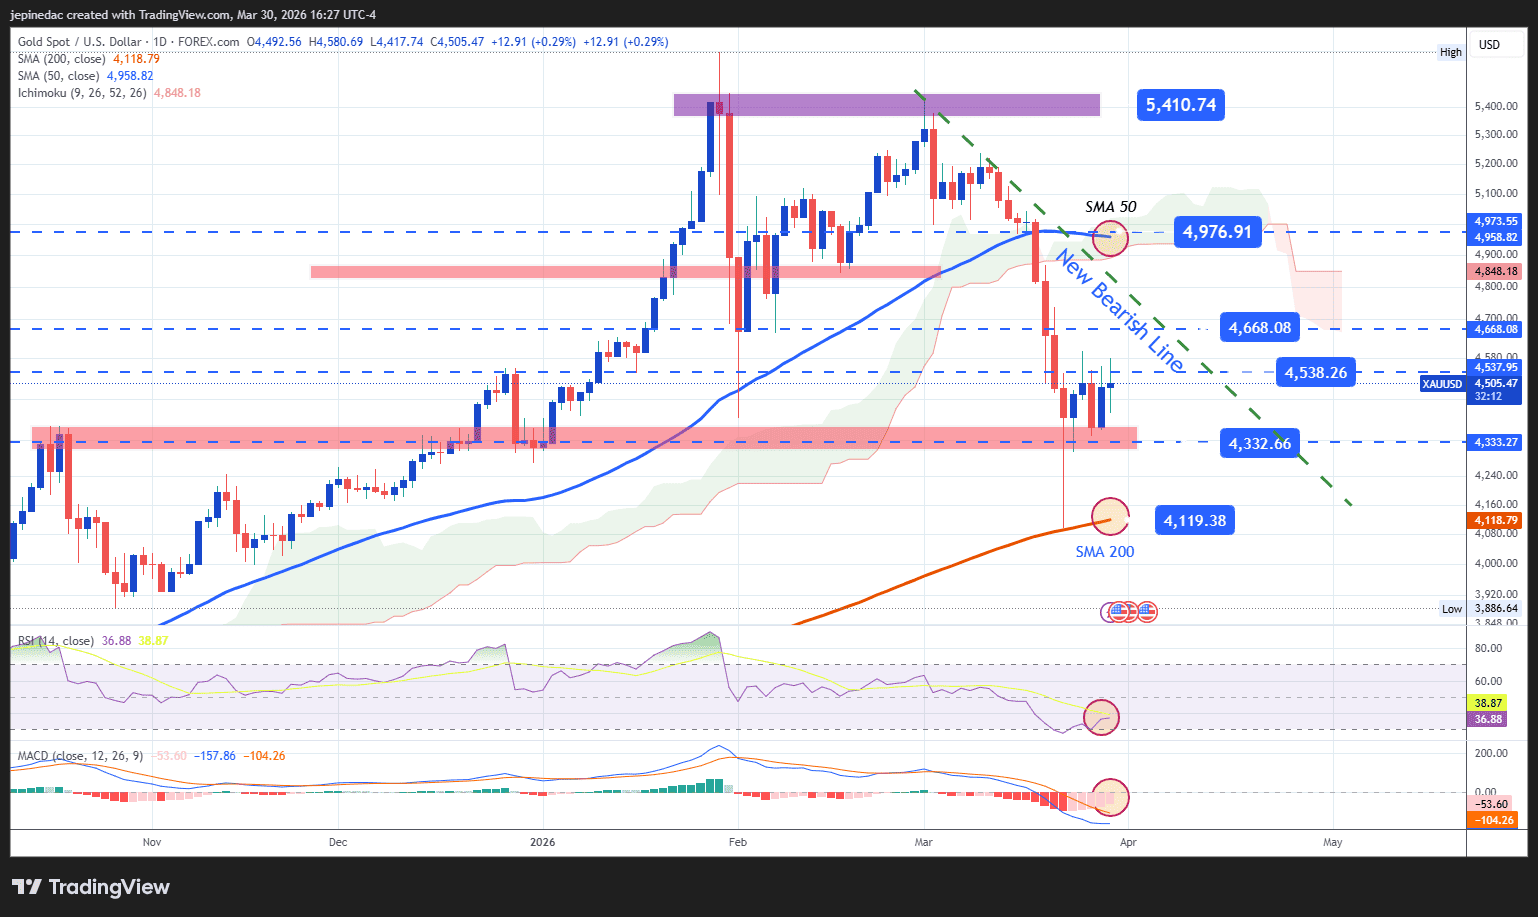
Source: StoneX, Tradingview
- A potential bearish trend begins to emerge: Recent gold price action is starting to suggest the formation of a downward trendline, which is becoming the most relevant technical structure on the chart. If weakness persists, this could evolve into a more dominant bearish trend. However, the lack of a clear directional move also suggests that a phase of indecision may continue to develop within this broader structure.
- RSI: The RSI shows a flattening pattern, indicating that both bullish and bearish momentum have lost strength. This supports the idea of short-term neutrality, which could persist if no clear directional signal emerges.
- MACD: The MACD histogram remains close to the zero line, signaling a balance in short-term moving average momentum. This further reinforces the presence of an indecisive price environment.
Key levels to watch:
- 4,668 USD – Key resistance: A level aligned with the nearest barrier above the emerging downtrend line. Moves toward this area could challenge the current structure and reintroduce a bullish bias in the short term.
- 4,538 USD – Near-term barrier: A relevant neutrality zone tied to recent retracements. Price action around this level could lead to the formation of a sideways range in the coming sessions.
- 4,300 USD – Key support: A critical level representing the most significant retracements in recent months. A sustained break below this zone could reinforce a more dominant bearish trend.
Written by Julian Pineda, CFA, CMT – Market Analyst
Follow him on: @julianpineda25