
Gold and silver markets remain stuck in volatile, two-way trade after January delivered record price swings across precious metals. While sharp end-of-month sell-offs produced classic reversal signals on higher timeframes, history suggests such patterns can lose potency following extreme volatility. With price action now marked by whipsaws and fading momentum, options markets are offering a more cautious read on whether recent pullbacks mark the start of a deeper correction or a pause before another leg higher.
View related analysis:
- Silver Outlook: Volatility Tests Bulls in Early 2026
- USD/JPY, AUD/JPY Outlook: Japanese Yen in Focus Ahead of Election
- GBP/USD, EUR/GBP Outlook: Sterling at a Crossroads as BoE Vote Split Looms
- ASX 200 market Outlook: Options Signal Choppy Trade Near 9,000
- US Dollar Rebound Faces Crucial Test Ahead of ADP, ISM and NFP
Gold and Silver Remain Volatile as Markets Search for Direction
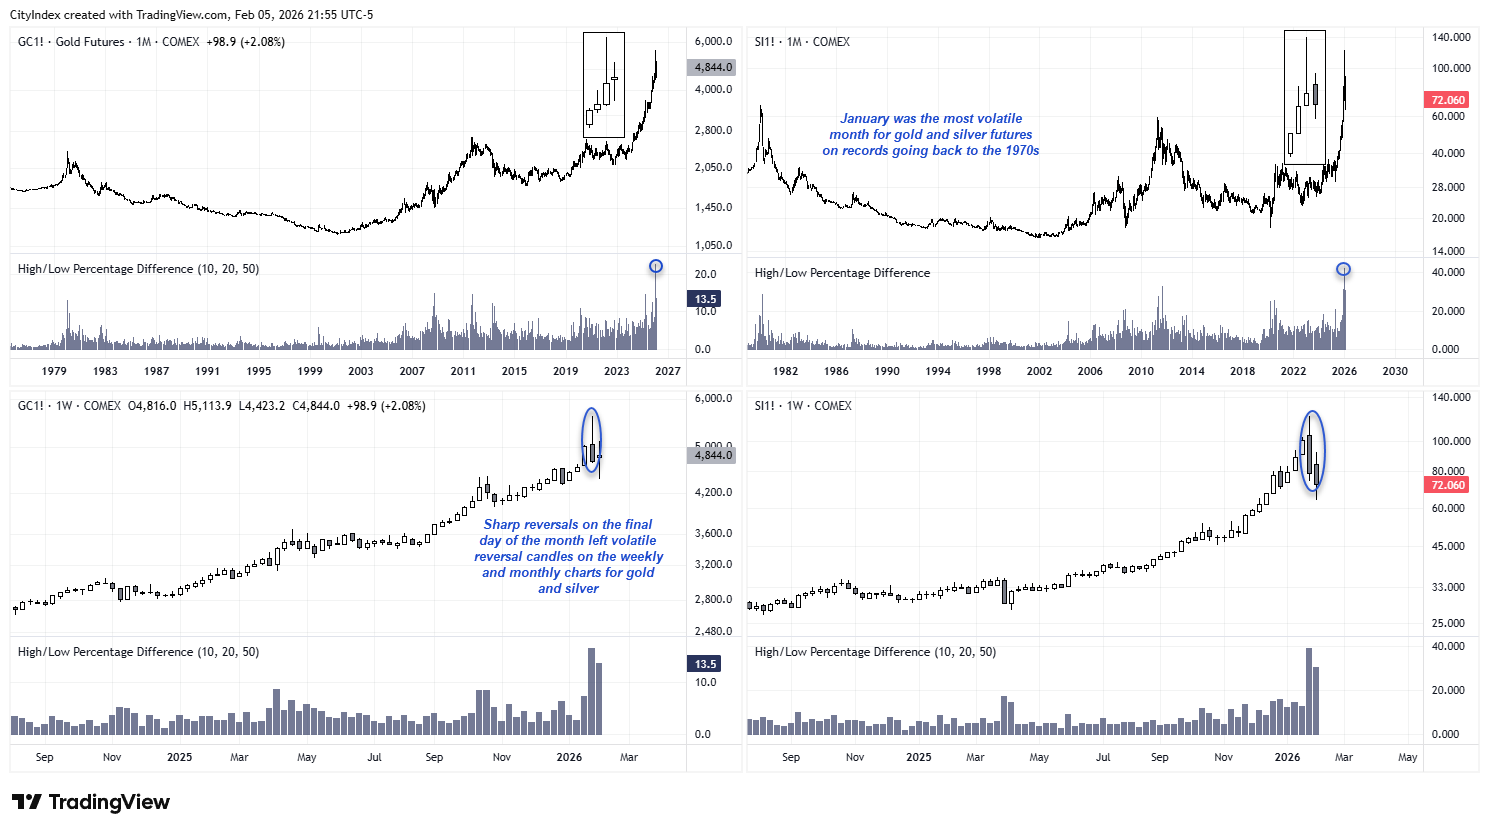
Nobody can say it hasn’t been a volatile start to the year for precious metals. Gold’s high-to-low range in January was 22.6% — its largest monthly range on records going back to 1975. Silver futures went one better with a 40% range. Both markets saw sharp sell-offs on the final day of the month, likely driven by end-of-month flows.
Monthly and Weekly Charts Flash Reversal Signals
Those late reversals from the highs left prominent reversal patterns on the monthly and weekly timeframes. Specifically, silver printed a shooting star on the monthly chart and a bearish engulfing pattern on the weekly, while gold showed pronounced upper wicks on both.
Source: COMEX, TradingView
Why Extreme Candlestick Signals Often Lose Their Edge
While classic candlestick analysis would label these as bearish reversal patterns, I tend to find such signals can often lose their potency when volatility becomes extreme. Not only are the candles themselves too large for most traders to work with, but markets often then enter what I’d describe as a ‘shell-shocked’ phase — where price action becomes fickle and volatility, while still elevated, begins to contract. That’s not to say conditions are no longer volatile, because they clearly are. But those expecting a repeat of January’s volatility in February are likely to be disappointed, based on historical observations.
Post-Shock Price Action: Volatility Contracts, Noise Increases
What we’re seeing now on both charts is typical behaviour following extremely volatile higher-timeframe candles: elevated but diminishing volatility, false breaks, and choppy price action marked by twists and turns in thinner liquidity.

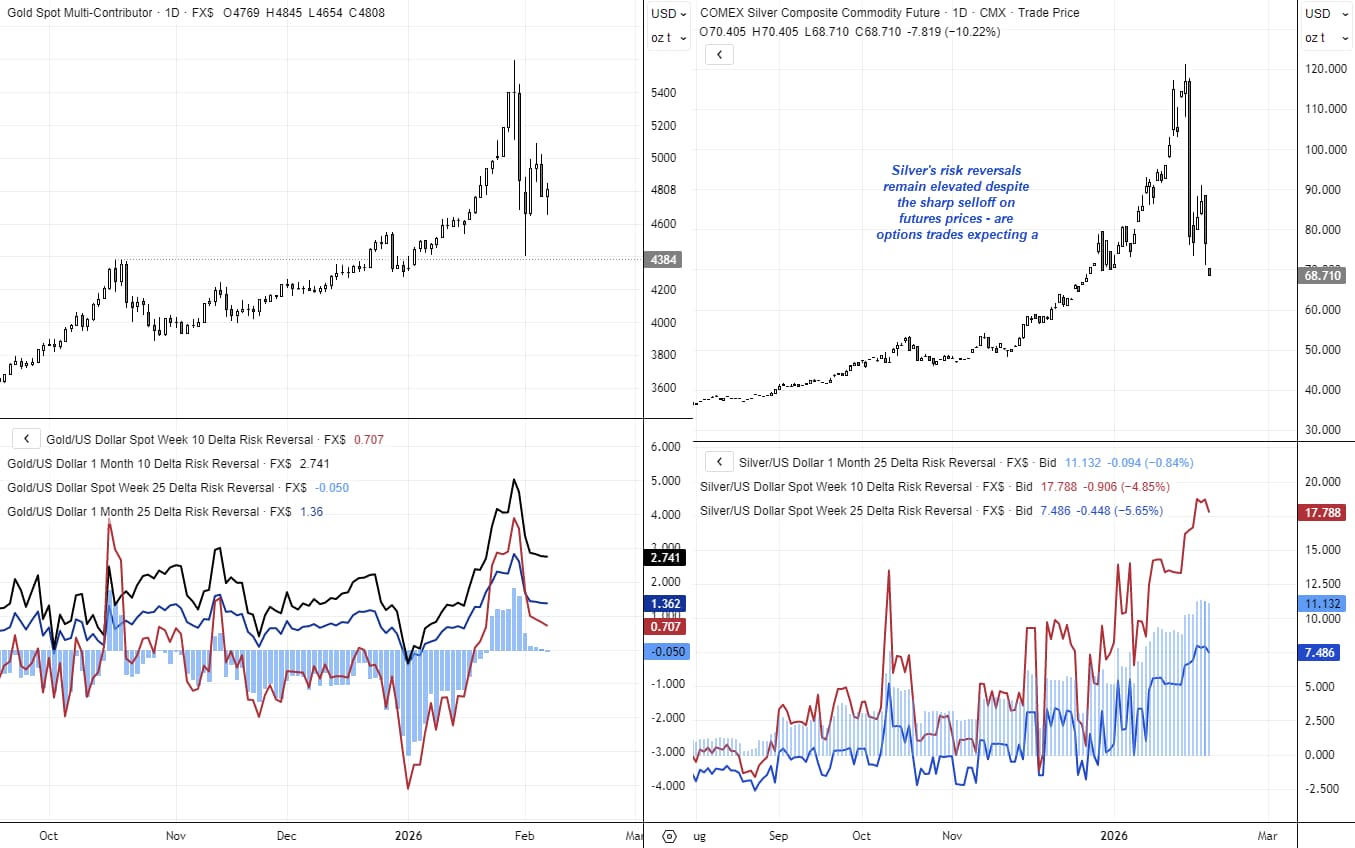
Options Markets Push Back on the Futures Sell-Off
Gold Risk Reversals Point to Consolidation, Not Capitulation
Gold risk reversals have tracked prices lower, but call demand remains positive relative to puts, suggesting options traders are cooling upside expectations without pricing a deeper downside. With gold futures holding support around the October highs, this looks more like consolidation after an extreme run than the start of a fresh bearish leg, raising the possibility that a near-term cycle low may already be in place.
Source: COMEX, CME, LSEG
Silver Options Signal Downside Is Being Questioned
Despite the sharp sell-off in silver futures, options markets are far less convinced. Silver risk reversals remain elevated, signalling continued demand for upside protection and little evidence of panic-driven put buying. In short, the futures market has moved faster than options traders are willing to validate.
That divergence matters after such extreme volatility. If traders were expecting another impulsive leg lower, risk reversals would typically compress or flip as downside protection is aggressively repriced. Instead, current positioning suggests downside is being viewed as increasingly limited, with options markets leaning towards choppy consolidation or a retracement higher rather than trend continuation.
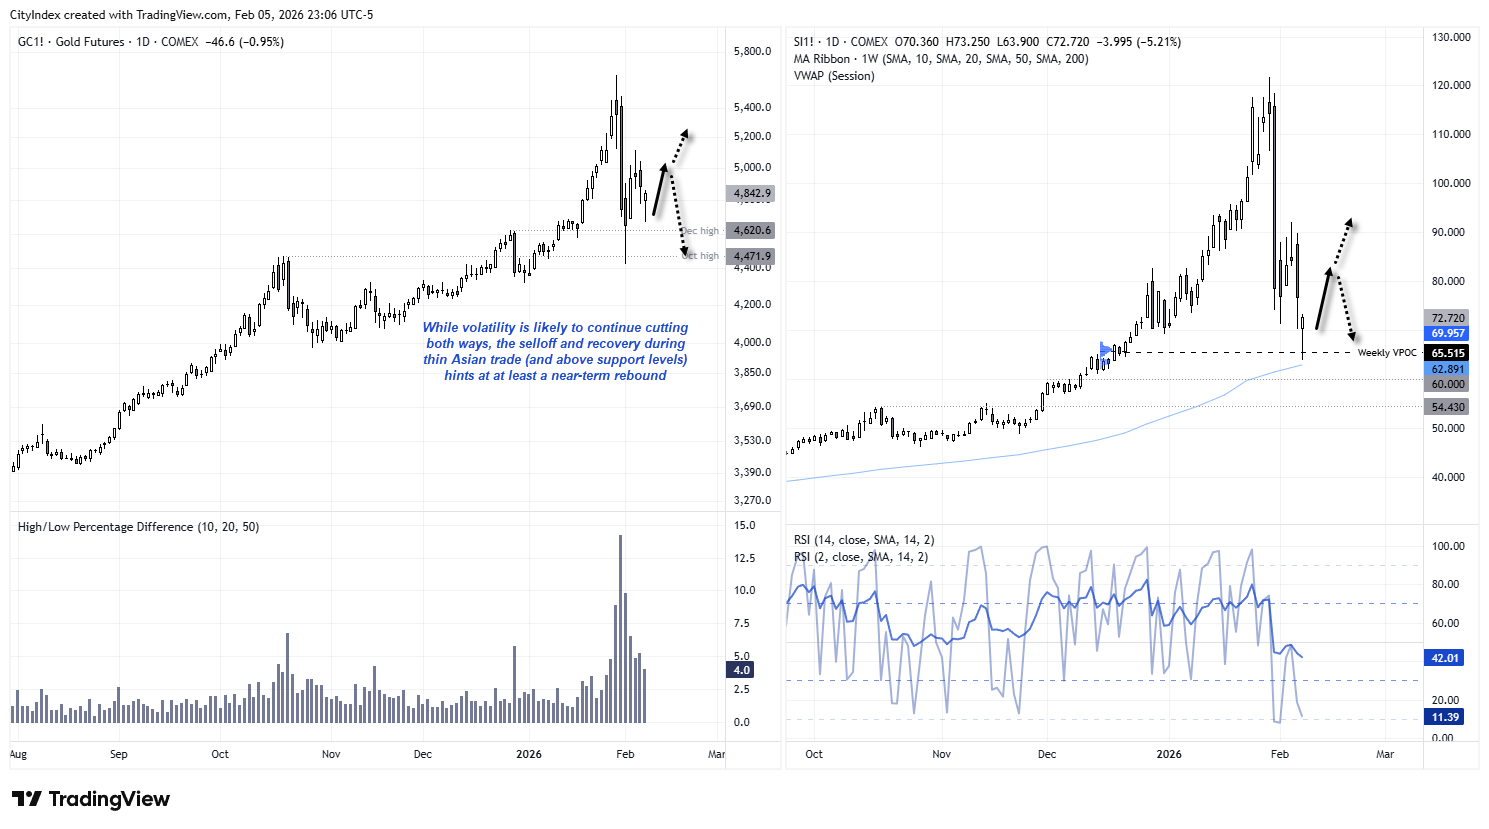
Gold and Silver Futures Short-Term Technical Outlook
The daily charts shows that gold and silver saw an early selloff in Asian trade earlier today. Yet those losses have been recouped, and if they were to close around current prices they’d leave bullish hammers. Also note that today’s lows – at the time of writing at least – have held above support levels; gold’s low respected the December high and silver’s respected the 20-week SMA and historical weekly VPOC.
I cannot say with any certainty that we’ve seen swing lows for the day, but it would not be out of character for such markets to bounce in current market conditions. As mentioned before, price action tends to be fickle and two-way volatility is rife following extreme levels of volatility. And the fact we’ve seen these markets fall and reverse during think Asian trade suggests this is simply a hunt for liquidity over any fundamental move – the kind of move that can suck bears in and punish them later in the session.
Source: COMEX, TradingView
View the full economic calendar
-- Written by Matt Simpson
Follow Matt on Twitter @cLeverEdge
How to trade with City Index
You can trade with City Index by following these four easy steps:
- Open an account, or log in if you’re already a customer
• Open an account in the UK
• Open an account in Australia
• Open an account in Singapore
- Search for the market you want to trade in our award-winning platform
- Choose your position and size, and your stop and limit levels
- Place the trade