Gold Bulls Regain Momentum
At the end of October, I warned that gold looked set to retrace higher and recover some of its losses from the record high. While bulls dragged their heels initially, they finally regained control of prices with conviction on Monday.
Gold futures jumped 2.8% at the start of the week, marking their best daily performance in three weeks. While we’ll likely see the usual extrapolation of this move and fresh calls for new highs, I doubt we’ll get a clean run from here given current positioning in the options market.
View related analysis:
- Senate Moves to End Longest U.S. Government Shutdown in History
- Gold Shows Tentative Signs Of Stability, Options Hint At Mild Recovery
- Gold Outlook: Rising Implied Volatility on Path to $4000
- Australian Dollar Price Action Setups: AUD/USD, EUR/AUD, GBP/AUD
Options Market Shows Lack of Confidence in Gold’s Bounce
The lower panel shows 25-day risk reversals for gold over the next week (blue histogram), month (blue line), and three months (gold line). The negative print for the 1-week tenor indicates stronger demand for puts (bearish bets) than calls. The fact that it moved further into negative territory on Monday while prices rallied suggests traders are paying a premium for downside protection — hardly a show of confidence among options traders.
Meanwhile, the 1- and 3-month risk reversals remain positive, showing bullish bets (calls) still outweigh bearish ones (puts) over those horizons. However, neither rose alongside prices on Monday, implying limited conviction in sustained gains over the one- to three-month outlook.
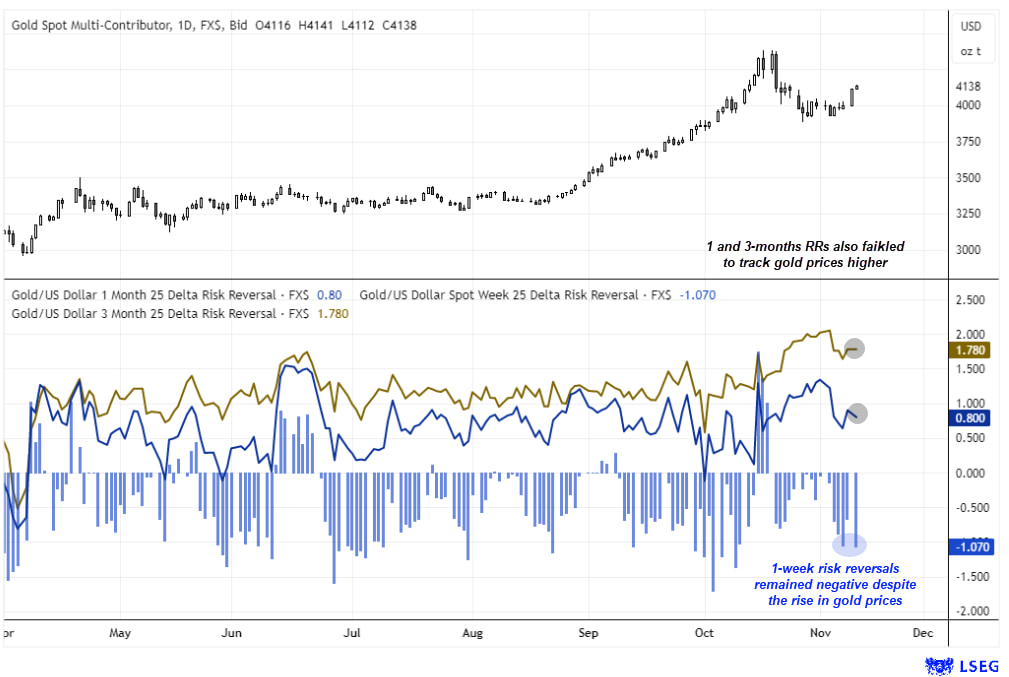
Chart analysis by Matt Simpson - data source: Source: LSEG Workspace

Gold Futures (GC) Technical Analysis
The daily chart shows gold rallying into a prior weekly volume point of control (VPOC), with bulls now eyeing a potential break above 4200. However, with the daily RSI (2) at its most overbought level in months, upside momentum may begin to slow. A sustained break above 4200 would likely see bulls targeting the 4300 area near the monthly pivot point.
Given the sharp selloff from the record high, I still view the current advance as a corrective bounce within a broader downtrend. I’m therefore watching for signs of a swing high forming between 4200 and 4300, anticipating at least a retest of 4000. A break beneath that level would expose the 3890 weekly VPOC and the 3800 handle as possible downside targets.
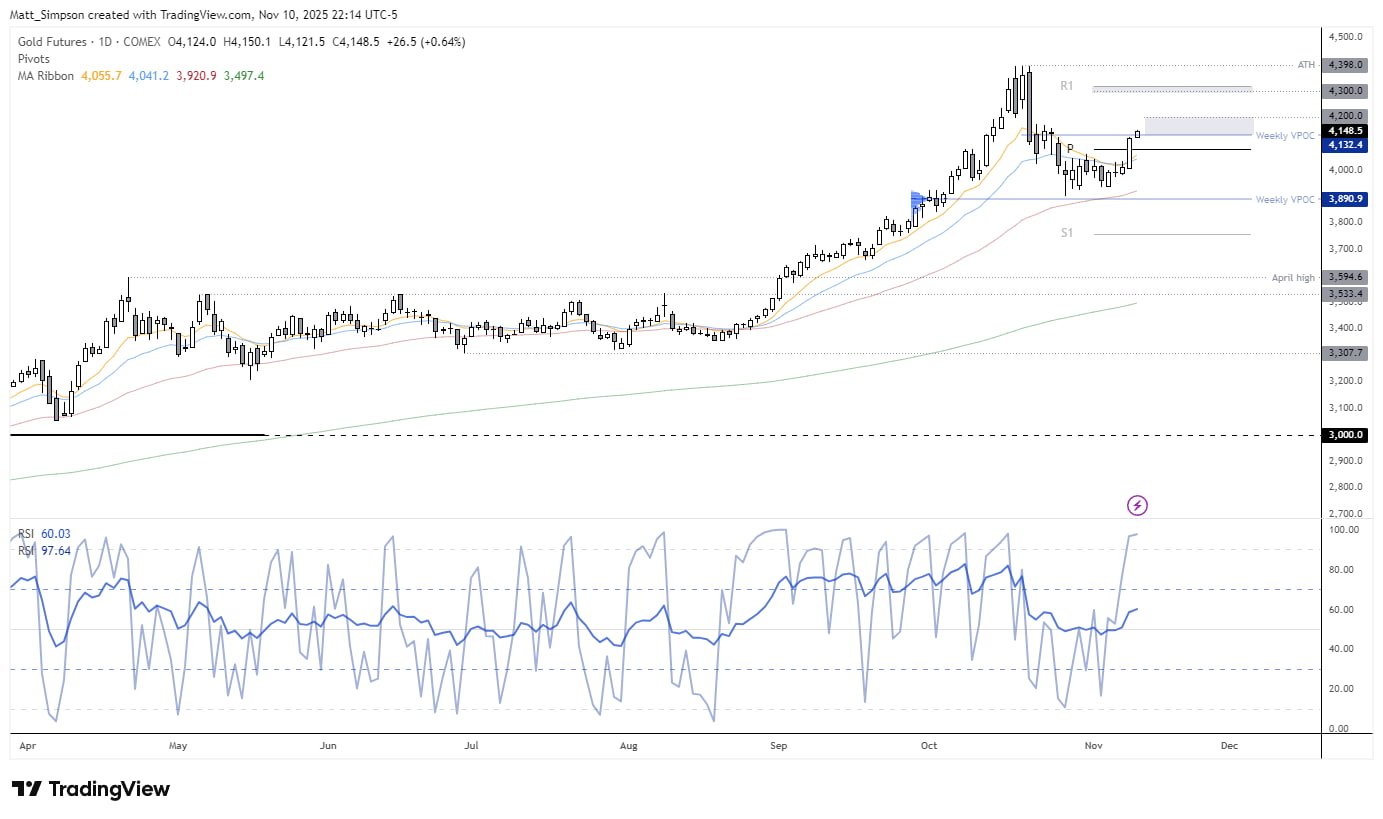
Chart analysis by Matt Simpson, Source: TradingView, COMEX Futures, Gold
View the full economic calendar
-- Written by Matt Simpson
Follow Matt on Twitter @cLeverEdge
How to trade with City Index
You can trade with City Index by following these four easy steps:
- Open an account, or log in if you’re already a customer
• Open an account in the UK
• Open an account in Australia
• Open an account in Singapore
- Search for the market you want to trade in our award-winning platform
- Choose your position and size, and your stop and limit levels
- Place the trade