

Gold and the Dow Jones, alongside precious metals and US indices, are facing steep drawdown risks under hawkish central bank policies and weakening market sentiment as the Middle East conflict escalates further. Such drawdowns often offer long-term dip buying opportunities, with current market risks pointing back toward 2024 highs.
In US indices, that’s only a few hundred points away. For gold, it implies a potential 1,000-point move lower, without pushing into extreme scenarios. Key levels and supports are outlined in the technical setups below for potential reversals, should fundamentals begin to align more positively.
So far, the Middle East conflict is extending its impact to crude oil and energy sectors, supply chains, and regional economies, weighing on markets dependent on these resources across Asia and Europe. This is dampening global market sentiment, especially as the situation feeds into central bank policy expectations amid persistent inflation concerns. Expectations shifted from gradual rate cuts across the second half of the year, to rate holds and rate hike risks as crude prices stick near the $100 mark, pointing higher.
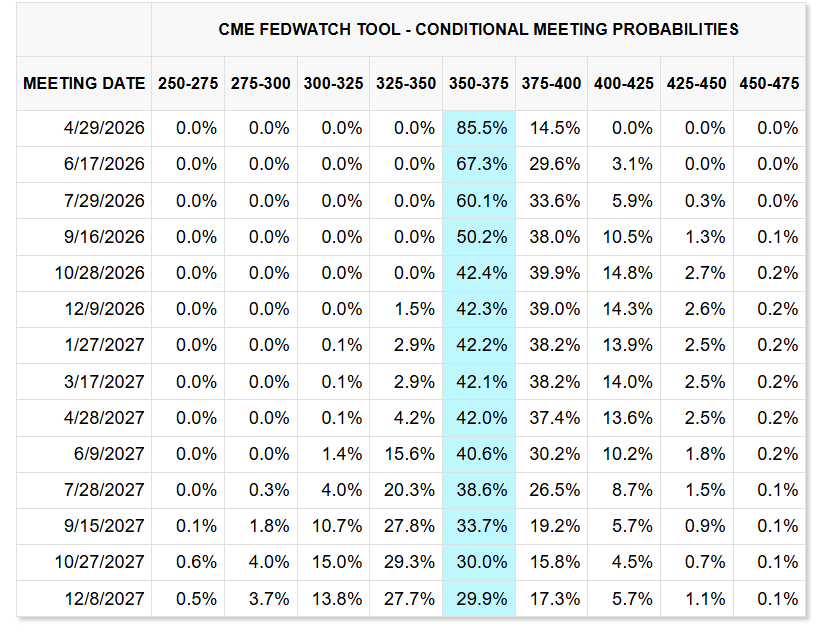
Source: CME Fed Watch Tool
The most severe disruptions likely ahead of any firm resolution. This is particularly the case given that the conflict originated around nuclear negotiations and has shifted toward broader regime change dynamics, which are unlikely to resolve as quickly as the earlier transitions seen in Venezuela and Syria.
Trump imposed a deadline for the reopening of the strait of Hormuz, keeping markets on edge ahead of the evening.
Key Levels to Watch
- Dow Jones: 44,900 – 2024 highs
- Gold: 3900, with a break lower opening the door to extended drawdowns toward 2024 levels
Dow Jones Outlook: Monthly Time Frame – Log Scale
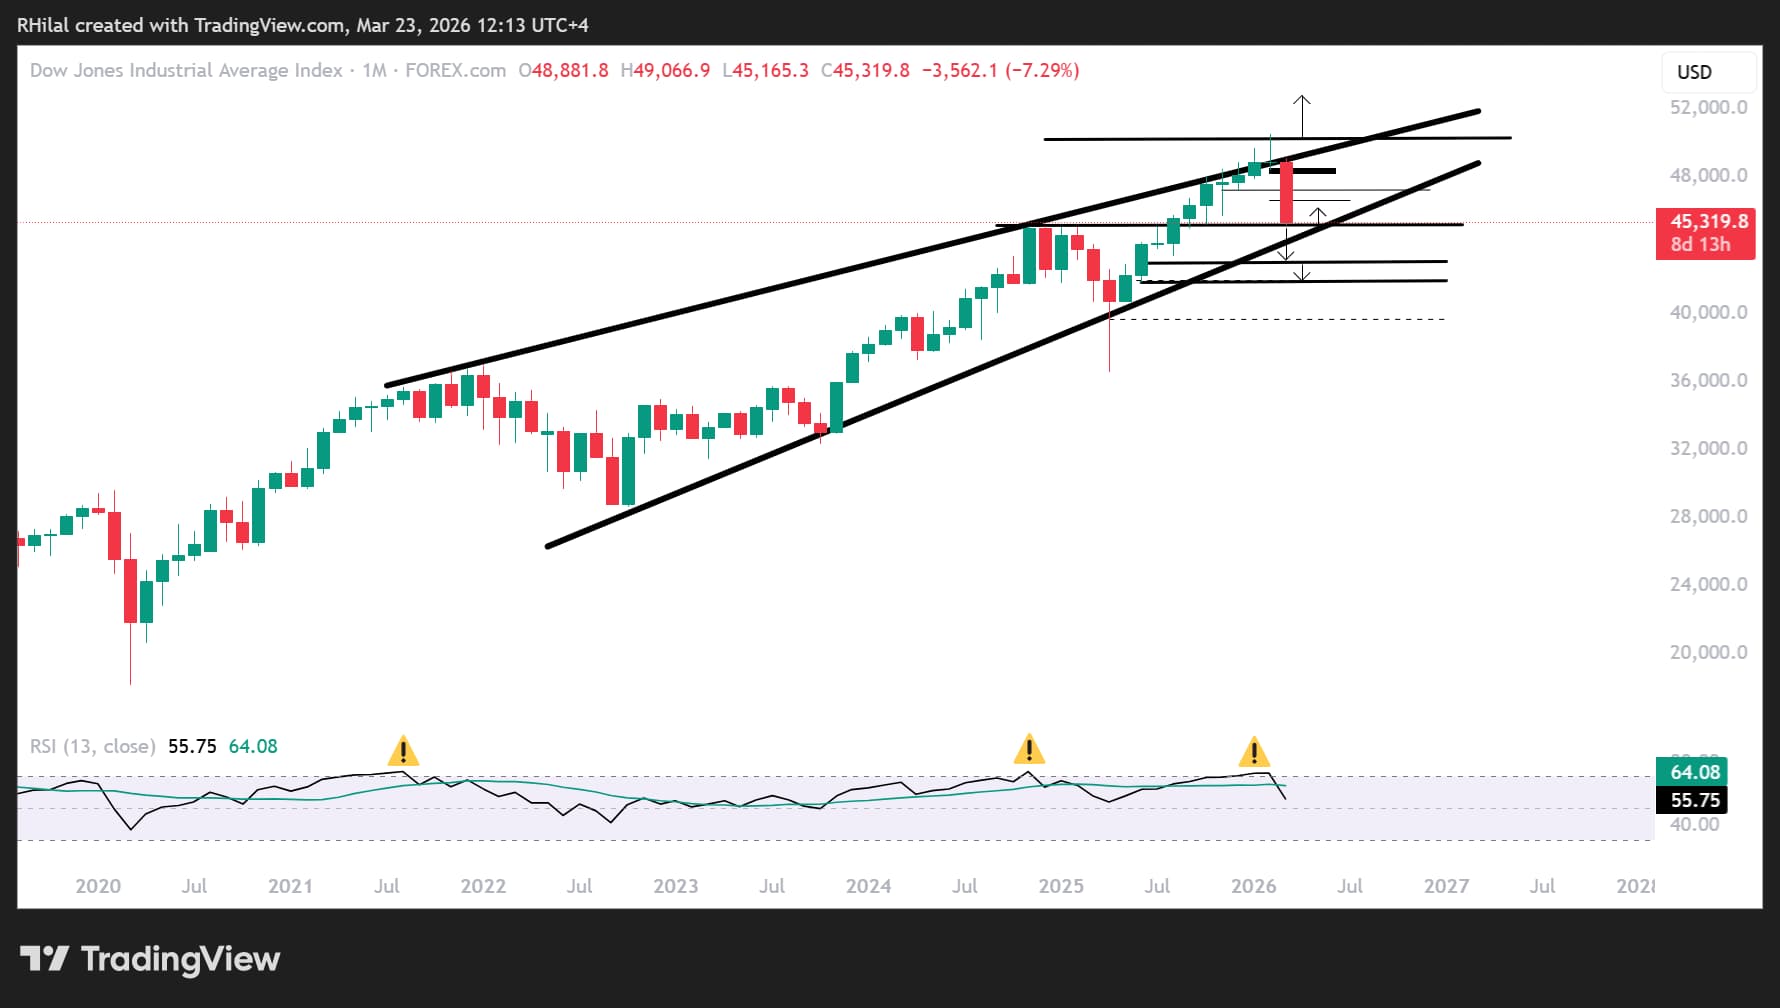
Source: Trading View
I’ve been flagging the monthly chart on the Dow Jones since the beginning of the year, where the US indices rally lacked strong correlation and was capped by cautious sentiment. The Dow has been tracing a consolidating diagonal pattern following the rebound from 2020 lows, peaking above the 50,000 mark in an unsustainable move before closing back within consolidation bounds. It is now testing the lower boundary of this structure, with risks of a further bearish breakout.
Bearish Scenario:
Price action is currently facing the 2024 highs near 44,900. A close below this critical support would support further losses toward key levels at 43,000 and 41,700, where dip buying interest could emerge. A break below these levels exposes a deeper correction toward 40,000, 38,000, and 36,000 respectively, marking the next potential distressed buying zones.
Bullish Scenario:
Short-term rebounds may develop following the sharp downside momentum, with recovery levels at 45,700, 46,700, and 47,300. A sustained move higher would begin to rebuild bullish momentum, which would require a break back above 48,900 and 49,900 to realign forecasts toward a move above the 50,000 level over the longer term.
In precious metals, profit-taking momentum remains intact, supported by the US dollar’s bullish hold. This allows room for a broader pullback following the exponential rally seen between 2024 and 2026, with downside scenarios potentially revisiting 2024 peak zones.
Gold Outlook: Daily Time Frame – Log Scale
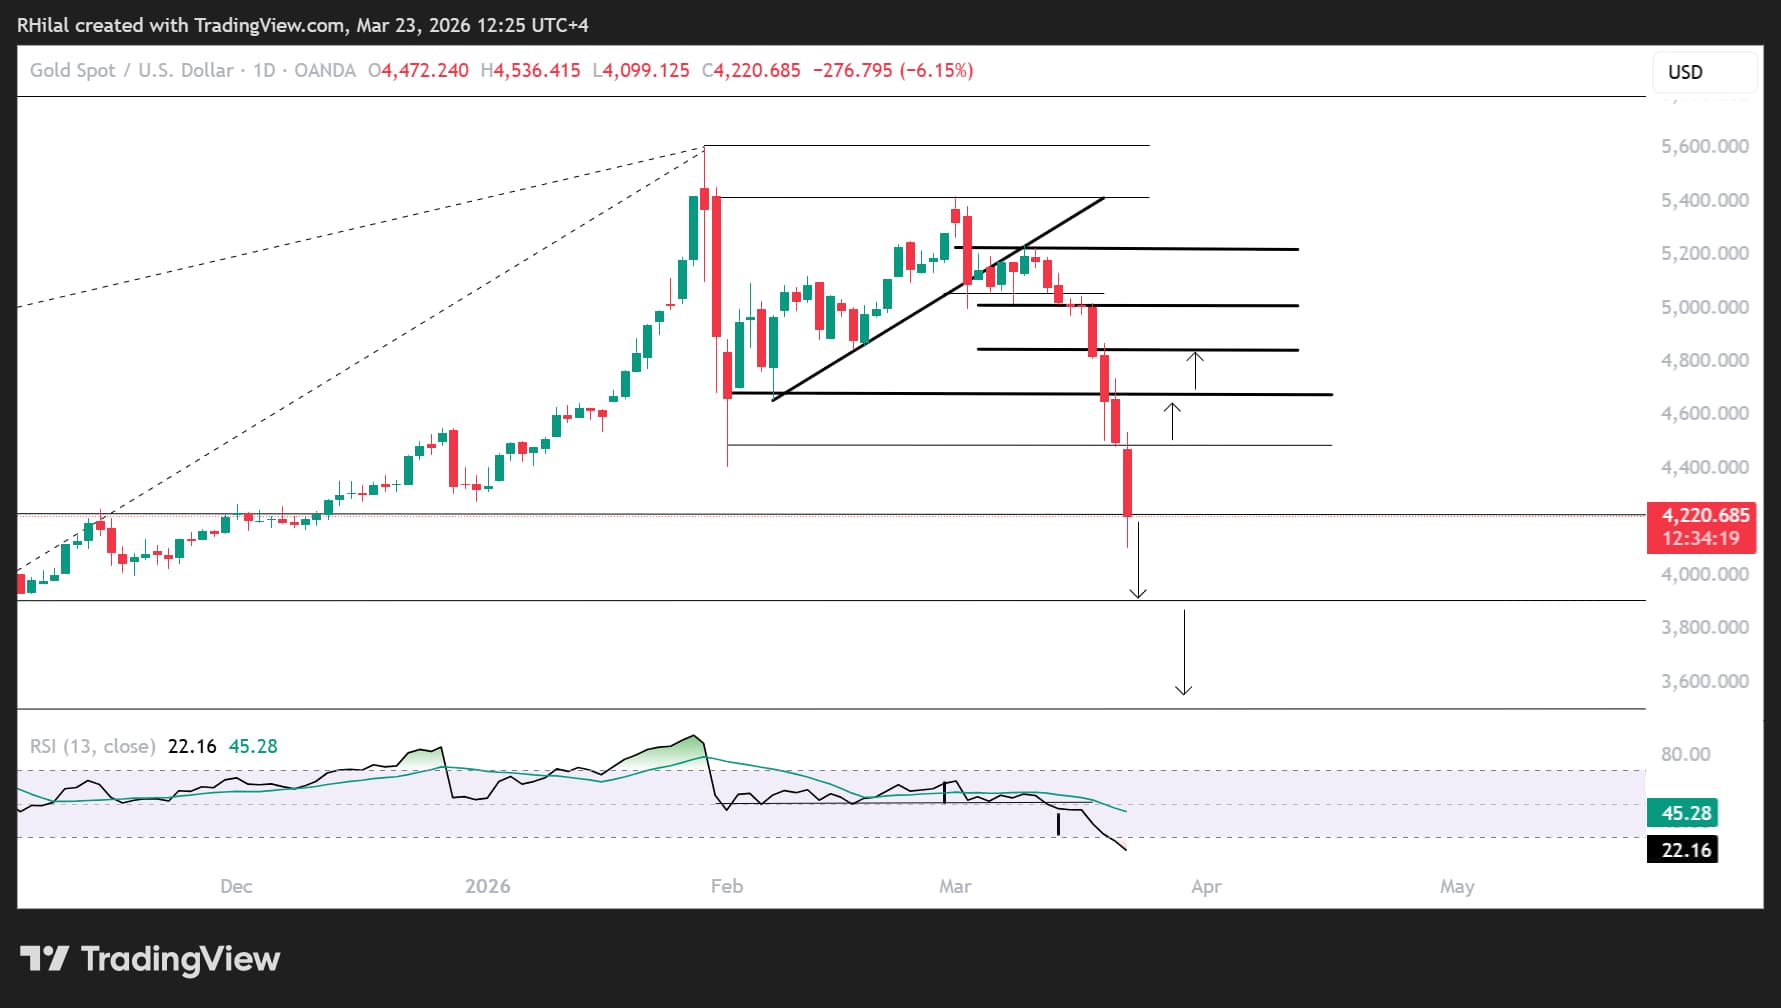
Source: Trading View
Gold and silver charts have signaled bearish pressure following their break below the February–March trendline, remaining under pressure as Middle East tensions intensify alongside hawkish central bank rhetoric, pushing both metals back toward February lows. The head and shoulders pattern on the RSI also supported the latest momentum drawdown.
This scenario was mentioned in my previous article: Gold, Silver Price Outlook: Breakdown Below 5000 and 80 Hints to a Steeper Fall. The updated scenarios are below:
Bearish Scenario:
In gold, price action is now tracing new yearly lows, with key support levels in sight at 4200 – 3900 – 3500 – and 3000 respectively. A daily close below these supports may confirm the drawdown to the next. A move toward 3000 would unwind the steep momentum built between 2024 and 2026, potentially allowing the metal to realign with longer-term structural gains.
Bullish Scenario:
On the upside, a close back above 4,480 could trigger a recovery toward 4,680 and 4,840, where the trend may either resume bullish continuation or face another leg lower toward the previously outlined support levels.
Written by Razan Hilal, CMT
Follow on X: @Rh_waves