


Gold futures are attempting to stabilise above the 4000 level after a sharp pullback, with early signs that a short-term rebound may be forming. Options markets show medium-term bullish positioning, yet short-dated skews remain negative — hinting that gains could be capped initially. Technicals on the weekly and daily charts point to a potential recovery phase, but multiple resistance layers suggest that bulls may still face challenges before any sustained move higher.
View related analysis:
- Gold Bulls Gain Momentum, Though New Highs Seems A Stretch
- Gold Shows Tentative Signs Of Stability, Options Hint At Mild Recovery
- Gold Outlook: Rising Implied Volatility on Path to $4000
- British Pound Outlook into UK CPI: GBP/USD, GBP/CAD, GBP/AUD
- Nvidia (NVDA) Earnings Stats for Nasdaq 100 Traders
Gold options traders display a mixed message
Risk reversals track the balance between bullish call demand and bearish put demand, with a rising line signalling expectations of higher prices. Notably, the 1- and 3-month RRs broke to new cycle highs last week ahead of spot, hinting that options traders may be positioning for gold to eventually break higher over those timeframes.
The 1-week RR, however, remains negative — showing puts still outweigh calls in the very near term. Short-dated signals are noisy, but it’s a reminder not to assume an immediate runaway breakout. Even so, a tactical long setup could be forming, even if gold initially struggles to clear last week’s high.
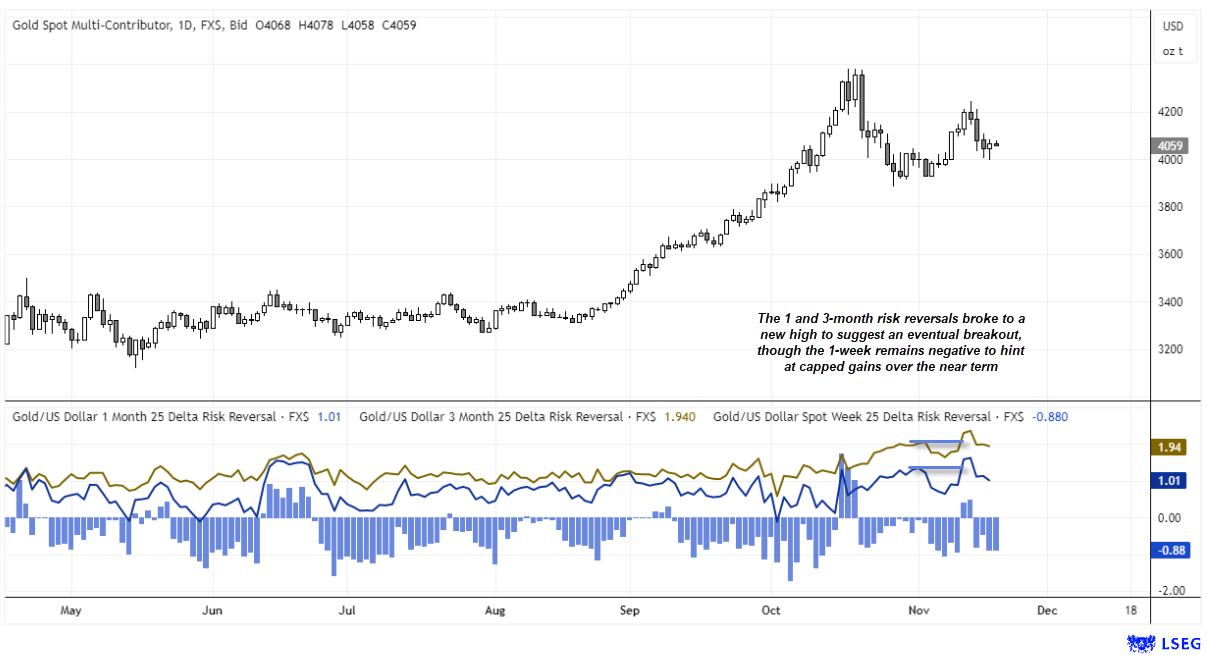
Chart analysis by Matt Simpson, Source: LSEG
Gold Futures Technical Outlook
The weekly chart hints we may have completed the first leg of a potential three-wave correction in gold. Prices held above 4000 last week, but the sizeable upper wick shows bulls surrendered much of their early gains. A short-term recovery is possible while Wave B develops, before a potential Wave C leg lower.
If Wave B were to stall near 4300, a symmetric move (Wave A = Wave C) would imply a downside target closer to 3800. For now, the focus is on the bullish setup forming on the daily chart.

Daily Signals Hint at Short-Term Rebound for Gold
The daily chart shows a second consecutive bullish hammer formed. While the daily RSI (2) is not oversold, it is close enough to consider a swing low is near, if not seen already.
A break above Tuesday’s high (4084) also clears the monthly pivot point and brings the 4200 handle and 4250 high into focus. A break above which opens up a run for 4300, near the monthly R1.
I can then reconsider the potential for a swing high to form around such resistance levels in anticipation of a move back down to 4000 and 3800.
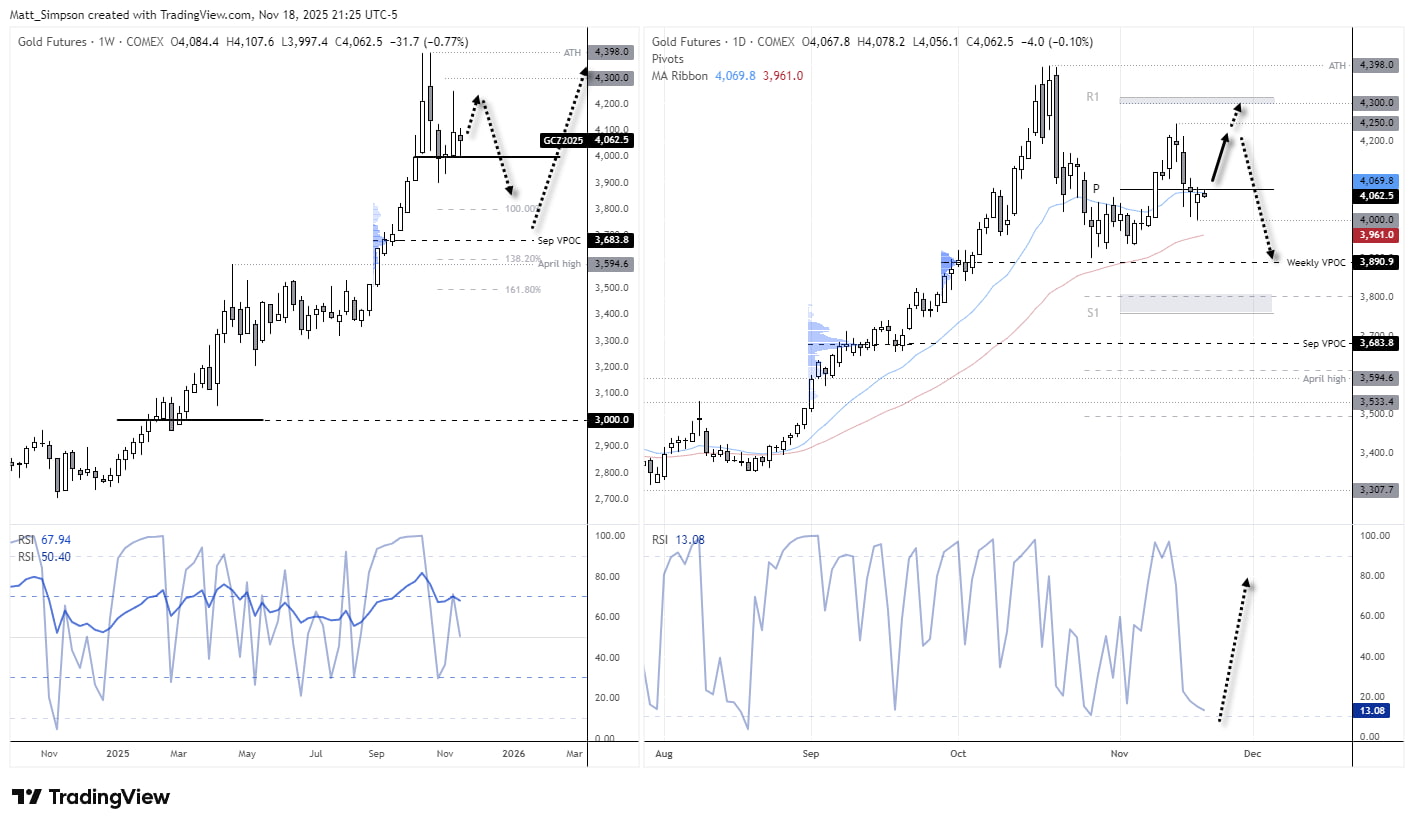
Chart analysis by Matt Simpson, Source: TradingView, COMEX Futures, Gold
View the full economic calendar
-- Written by Matt Simpson
Follow Matt on Twitter @cLeverEdge
How to trade with City Index
You can trade with City Index by following these four easy steps:
- Open an account, or log in if you’re already a customer
• Open an account in the UK
• Open an account in Australia
• Open an account in Singapore
- Search for the market you want to trade in our award-winning platform
- Choose your position and size, and your stop and limit levels
- Place the trade


