
Gold continues to recover from its October low, but the rally lacks conviction. Volume is thinning, momentum is soft, and price action looks increasingly corrective. With the FOMC meeting in focus and the US dollar holding firm at support, conditions remain primed for volatility — and potentially a deeper setback for gold if the Fed disappoints dovish expectations.
View related analysis:
- Japanese Yen Weakness Lifts USD/JPY and EUR/JPY while Nikkei Holds 50k
- US Dollar Shows Signs of Stability Into PCE Inflation: USD/JPY, USD/CHF
- US Dollar Seasonality in December: USD/JPY, USD/CHF, EUR/USD, AUD/USD
- S&P 500 Seasonality: How Santa's Rally Across Wall Street Stacks Up
Gold Stalls as the US Dollar Stabilises Into the FOMC
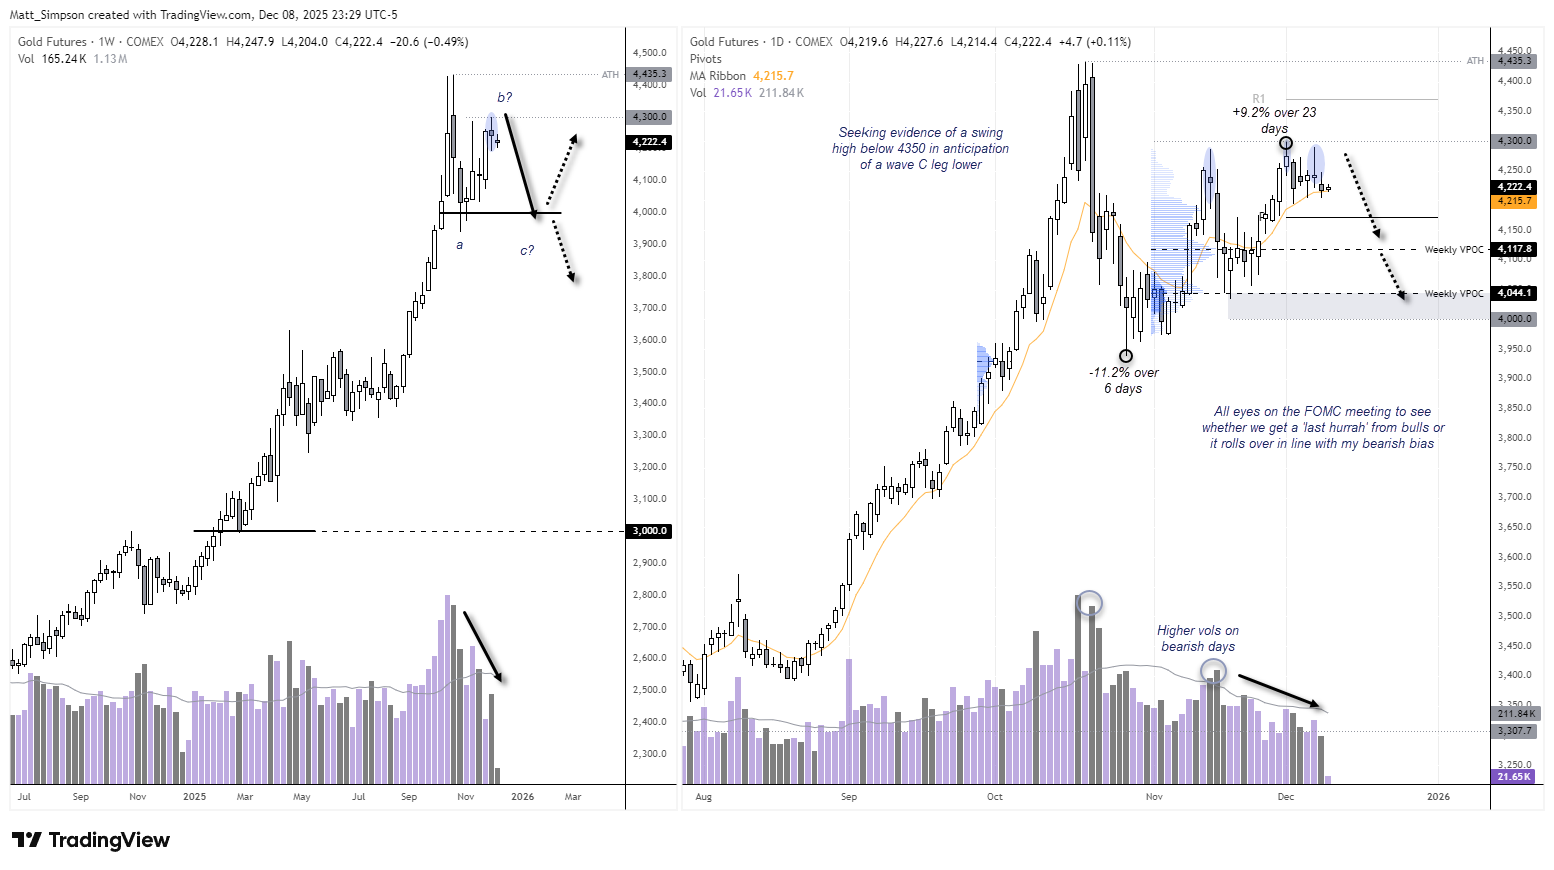
Gold Futures (GC) Technical Analysis
It has been 34 days since gold last traded at an all-time high. Its -6.7% single-day decline on heavy volume marked the start of an 11.1% correction. And although prices have recovered from the October low, the fact it has taken 23 days to do so highlights a weak effort from bulls overall. The also weekly chart shows a small-ranged spinning top doji formed just below 4300 last week.
Furthermore, daily volumes are trending lower even as price grinds higher in a choppy fashion — again suggesting the rebound from the October low is corrective rather than impulsive.
With the FOMC meeting approaching, volatility could push gold in either — or both — directions this week. Even if gold breaks above 4300 in the near term, my view is that it may still fall short of retesting its record high before the next major decline, assuming it enters a wave ‘C’ of an ABC correction from the peak.
Charts prepared by Matt Simpson, Source: TradingView

US Dollar Index (DXY) Technical Analysis
I continue to hold the view that the US dollar is likely to trend lower next year, which should ultimately help gold break to new highs. In the near term, however, the US dollar index is holding above its 100-day EMA and the monthly S1/November low cluster.
Given my suspicion that the Fed will not be as dovish as markets hope, there’s still scope for a short-term bounce in the US dollar — which could weigh on gold before the broader downtrend resumes.
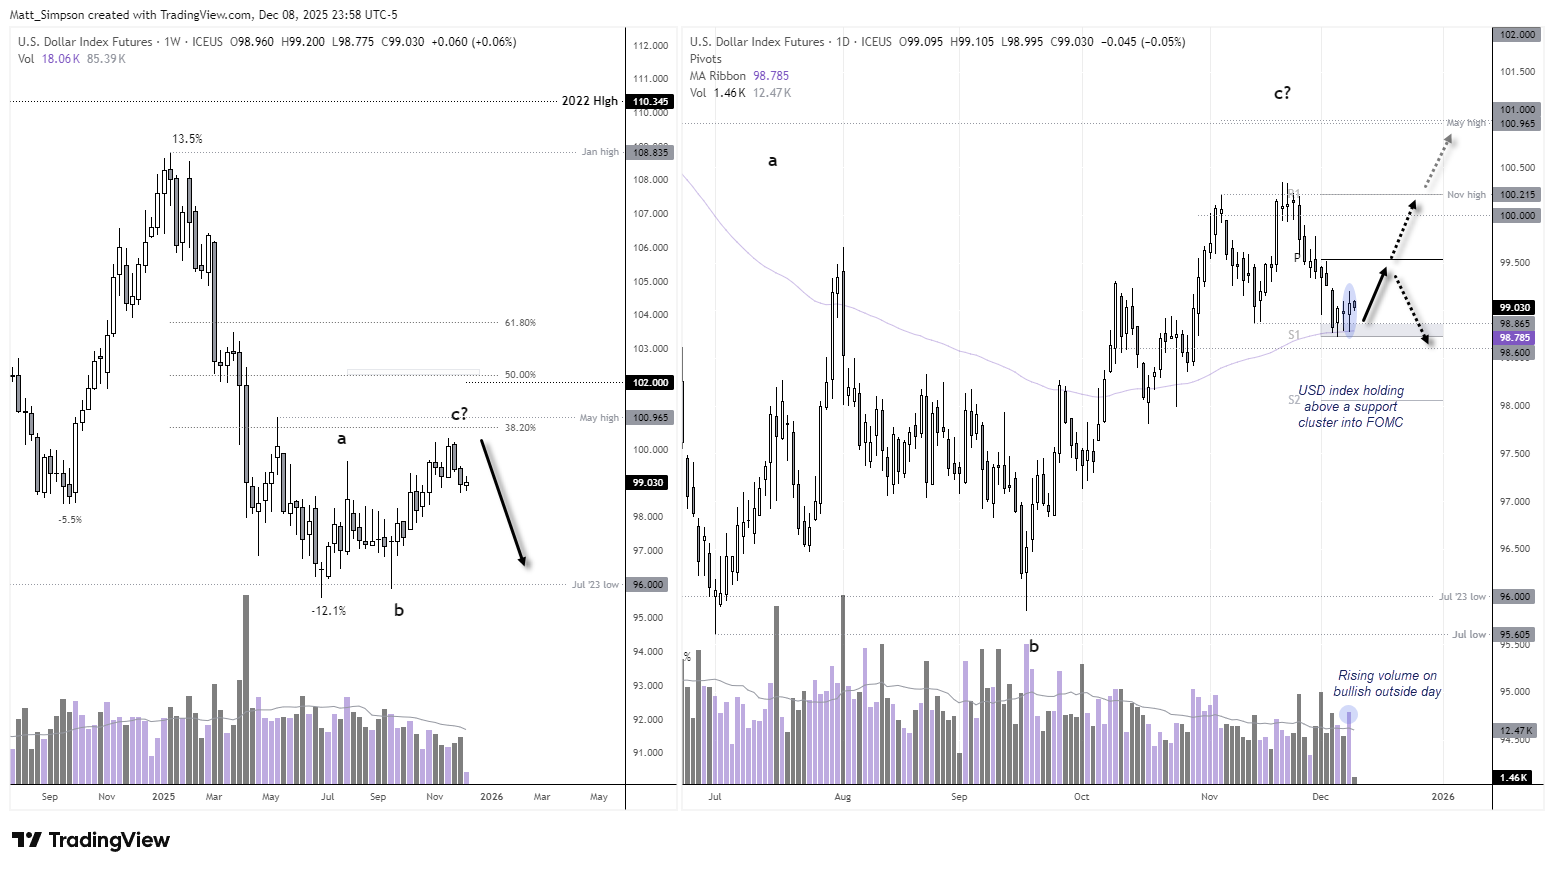
Chart analysis by Matt Simpson - data source: TradingView U.S. Dollar Index Futures
View the full economic calendar
-- Written by Matt Simpson
Follow Matt on Twitter @cLeverEdge
How to trade with City Index
You can trade with City Index by following these four easy steps:
- Open an account, or log in if you’re already a customer
• Open an account in the UK
• Open an account in Australia
• Open an account in Singapore
- Search for the market you want to trade in our award-winning platform
- Choose your position and size, and your stop and limit levels
- Place the trade