


Gold continues to hold its uptrend as crude oil absorbs fresh geopolitical headlines from the Middle East. While Brent’s sharp spike injected volatility into energy markets, bullion’s response has been more measured. Options positioning suggests institutions are leaning higher over the medium term — but with protection firmly in place. The message from markets is clear: gold is supported, not yet in breakout mode.
View related analysis:
- Gold Price Outlook: Are Options Traders Front-Running a Breakout?
- Gold Price Outlook: Options Sentiment Extreme as Bears Target 4800
- Crude Oil Risk Premium Rises as US–Iran Tensions Escalate
- FX Futures Positioning: US Dollar, EUR/USD, GBP/USD | COT report
Gold Supported, Breakout Awaiting Escalation Catalyst
Crude oil remains the most directly exposed asset to developments in the Middle East, so it’s no surprise that Brent surged as much as 13% at Monday’s open. However, the bulk of that move occurred within the first minutes of trade, with prices since retracing a portion of the spike. That suggests the initial jump was largely a reaction to weekend headlines rather than confirmation of fresh escalation during Monday’s session.
Iran has vowed to effectively block the Strait of Hormuz by targeting vessels attempting to transit the waterway. While such a closure would lack legal standing under international maritime law, direct attacks, mining activity, drone strikes or credible threats would raise insurance costs and safety risks to the point that commercial shipping could halt regardless. That distinction — legal authority versus practical disruption — is critical for markets.
For now, price action reflects a market waiting for clarity.
On the 1-hour chart, Brent crude is consolidating within the opening two-hour range, with support reinforced near the monthly R1 pivot around 76. A decisive break higher would likely require confirmation of broader escalation, while signs of de-escalation could allow some of the embedded risk premium to unwind. Until then, prices appear biased toward short-term range trading between roughly 76 and 80.

Brent Crude Oil Futures Technical Analysis
The daily chart shows Monday’s sharp gap higher stalled between the 2025 high and the August 2022 high. The move was accompanied by exceptionally strong volume, underscoring the intensity of the initial reaction to geopolitical headlines. However, prices surrendered roughly half of the session’s gains, suggesting early enthusiasm faded as follow-through buying failed to materialise.
As long as oil’s risk premium remains elevated, precious metals are likely to retain a geopolitical bid. However, without further escalation, momentum in gold and silver may struggle to accelerate meaningfully beyond current levels.
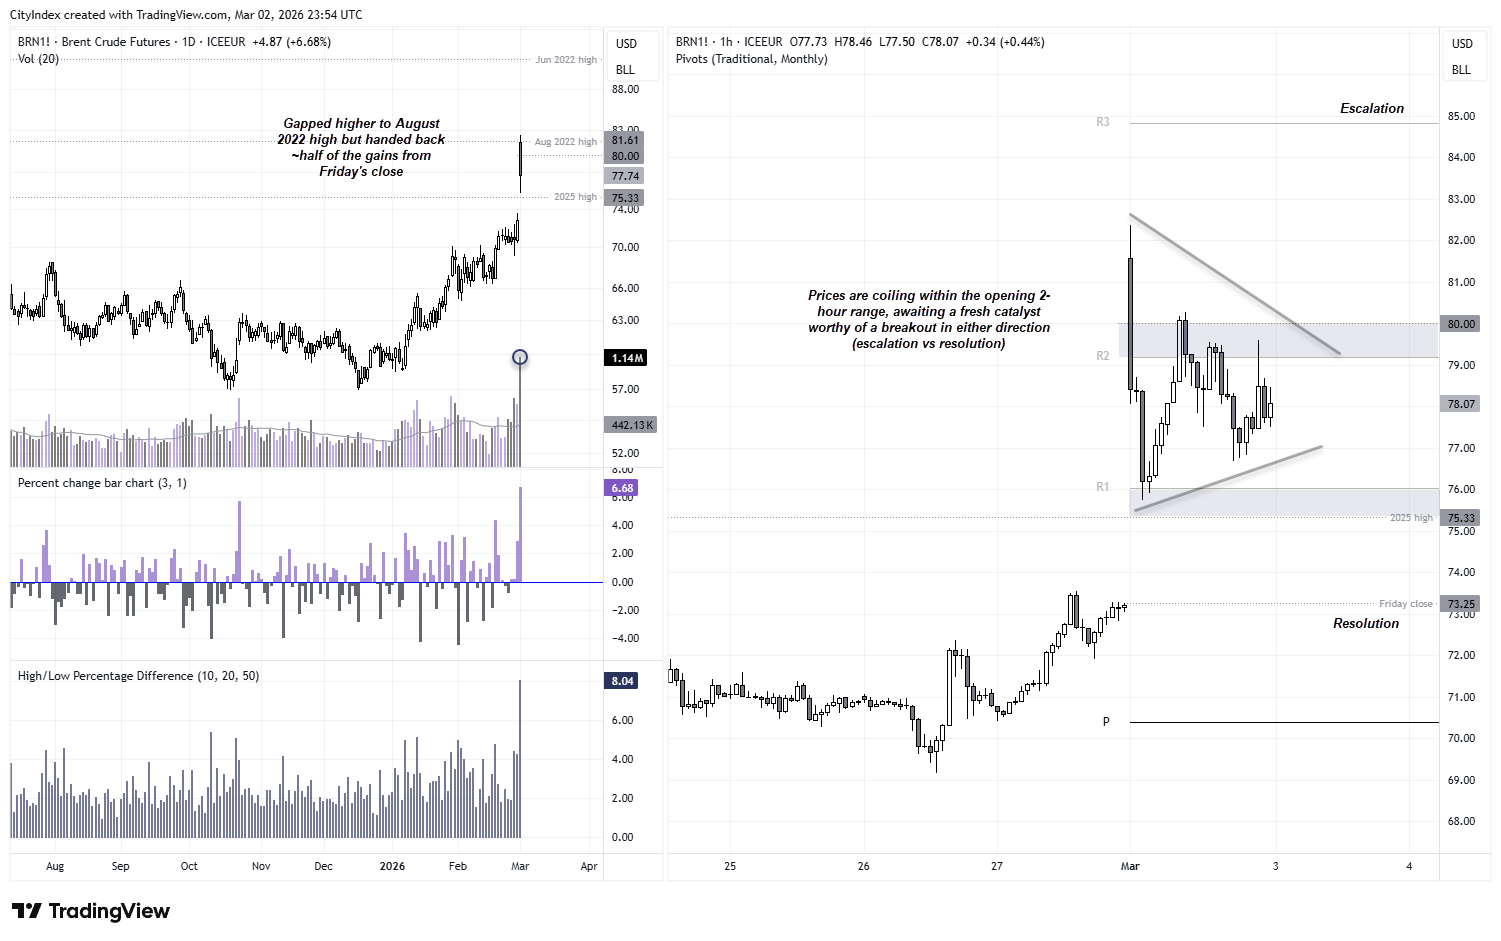
Chart analysis by Matt Simpson - Source: TradingView
Gold Supported by Energy Risk, Awaiting Escalation Catalyst
Gold is reacting less to the headline spike in crude and more to whether that energy shock evolves into something sustained. A brief oil gap higher supports safe-haven demand, but a prolonged disruption to energy flows — especially through the Strait of Hormuz — would introduce a deeper inflation and growth shock dynamic. That is the environment where gold tends to transition from defensive hedge to momentum trade.
For now, bullion appears supported rather than euphoric — reflecting a market that recognises elevated risk but is not yet pricing systemic escalation.

Options Positioning Shows Controlled Bullish Bias
Risk reversals paint a more nuanced picture than spot price action alone. The 1-week 10-delta measure remains negative, meaning traders are still paying up for downside protection. In other words, despite the geopolitical bid, there’s meaningful demand for short-term puts. That aligns with Monday’s long upper and lower wicks — markets are pricing volatility, not a straight-line rally.
Further out, 1-month risk reversals are positive, with call demand outweighing puts. That suggests institutions are positioning for higher prices over the coming weeks while hedging near-term downside. It’s measured upside exposure with protection in place — not euphoric buying.
Daily chart of Gold Spot (USD/oz) showing a strong uptrend with price trading above the 10- and 20-day exponential moving averages (around 5200 and 5100), with recent consolidation near highs following February’s spike and pullback.
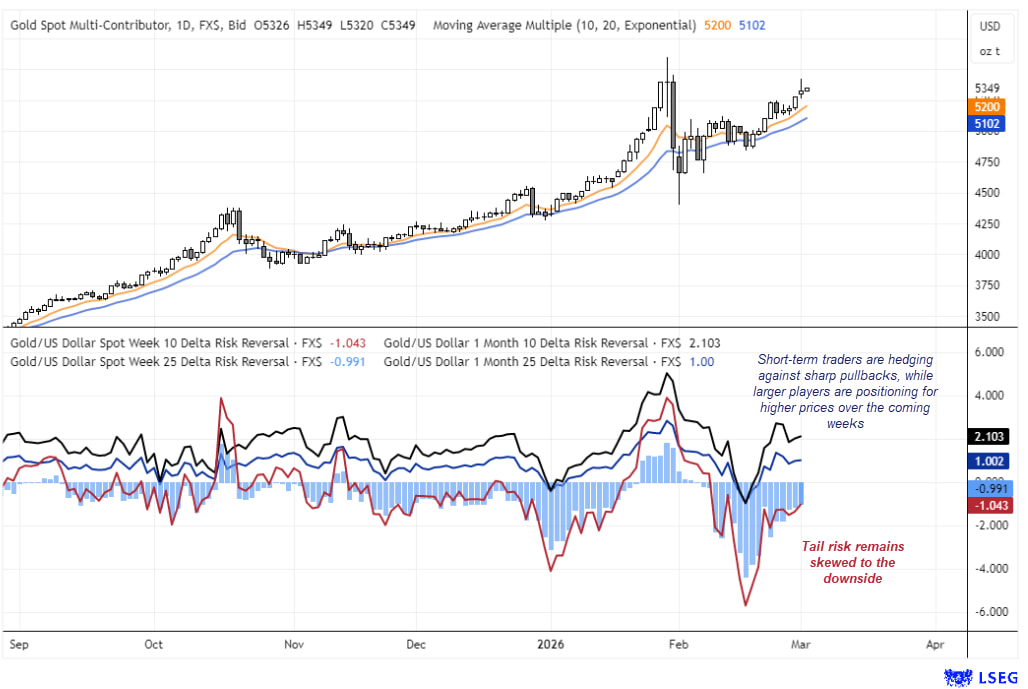
Source: CME, LSEG
Gold Futures (GC) Technical Analysis
Gold continues to hold within a well-defined uptrend, trading comfortably above the 10- and 20-day EMAs (near 5200 and 5100). The broader structure remains constructive, but momentum is no longer accelerating — it’s consolidating.
Yesterday’s push briefly cleared 5400 before fading into a spinning top doji, reinforcing the idea that buyers are present but not aggressive. With RSI (2) stretched and oil volatility cutting both ways, the near-term path of least resistance may be sideways to slightly lower rather than an immediate breakout.
On the 1-hour chart, price action suggests the potential for a lower high beneath 5400. Unless a fresh risk-off catalyst emerges, rallies into that zone may continue to attract profit-taking. Initial support sits around 5270, with 5200 — near the short-term EMA cluster — a more meaningful level where dip-buyers could re-engage.
In short, the trend remains higher, but gold looks supported rather than in breakout mode. A sustained move above 5400 would likely require a clear escalation catalyst, while controlled pullbacks toward 5200 may be viewed as opportunities by medium-term bulls targeting 5500–5550.
Daily and 1-hour charts of COMEX gold futures showing price consolidating near 5400, resistance at 5500–5600 and support around 5200 and 5000 as short-term momentum cools from overbought levels.
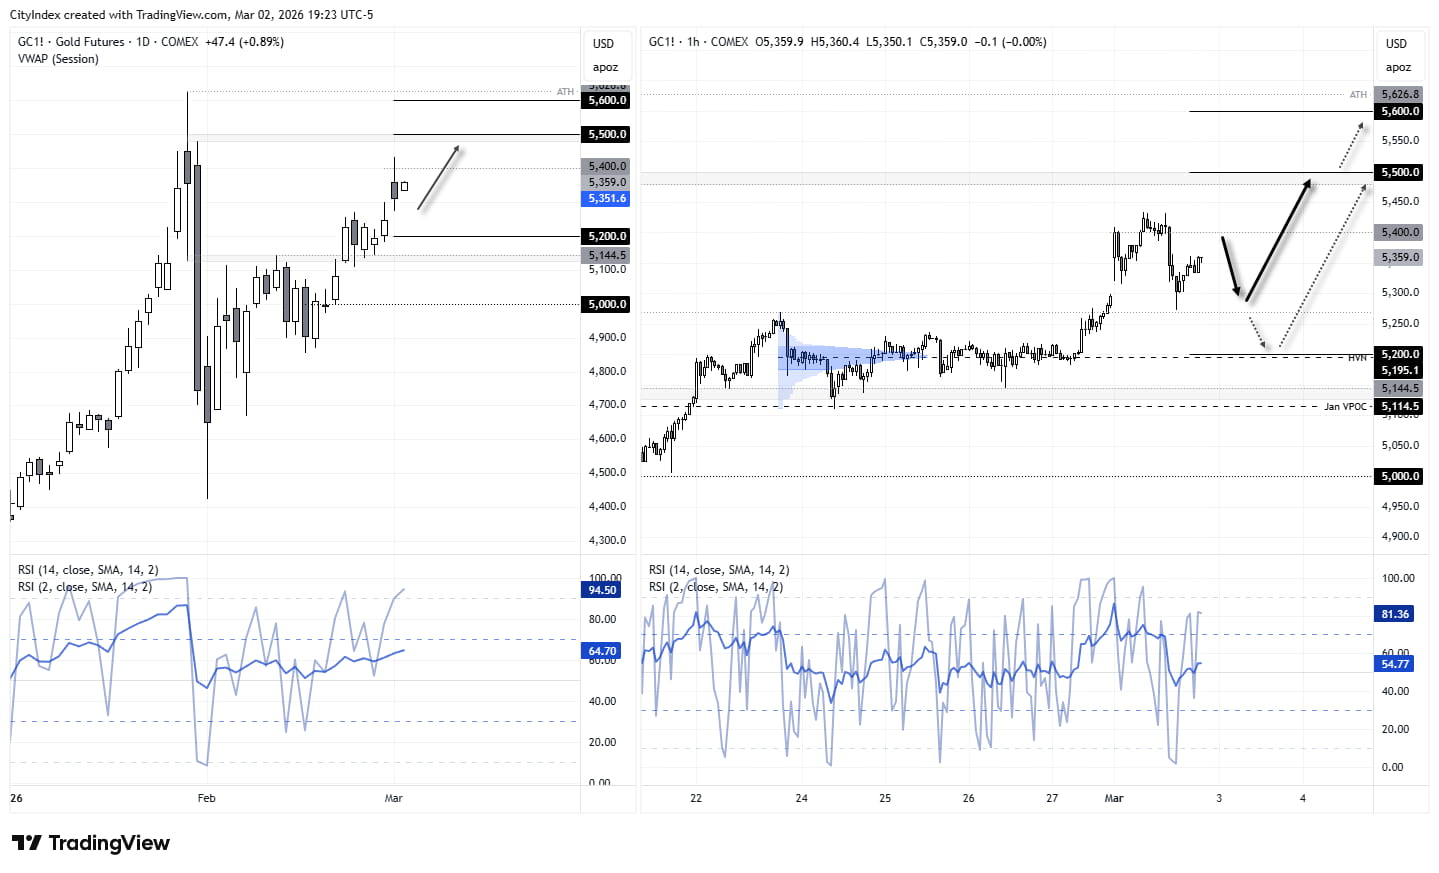
Source: COMEX, TradingView
View the full economic calendar
-- Written by Matt Simpson
Follow Matt on Twitter @cLeverEdge
How to trade with City Index
You can trade with City Index by following these four easy steps:
- Open an account, or log in if you’re already a customer
• Open an account in the UK
• Open an account in Australia
• Open an account in Singapore
- Search for the market you want to trade in our award-winning platform
- Choose your position and size, and your stop and limit levels
- Place the trade


