
Gold’s rebound from 4,700 has been impressive, but price action near record highs suggests bulls may need to tread carefully.
Last week I was looking for gold to extend its bounce after it appeared to find support around 4,700. While I did not have a specific upside target in mind, this week’s price action suggests bulls may want to tread carefully.
The US CPI report is also due for release, which could deliver a bearish knock-on effect for gold if it comes in even slightly hotter than expected.
View related analysis:
- Gold and Silver Outlook: Whipsaws Persist, Bulls Look for a Bounce
- Silver Outlook: Volatility Tests Bulls in Early 2026
- GBP/AUD Slumps to 13-Year Low as RBA–BoE Divergence Widens
- FX Futures Positioning: US Dollar, EUR/USD, USD/CAD | COT report
Gold Futures (GC) Technical Analysis
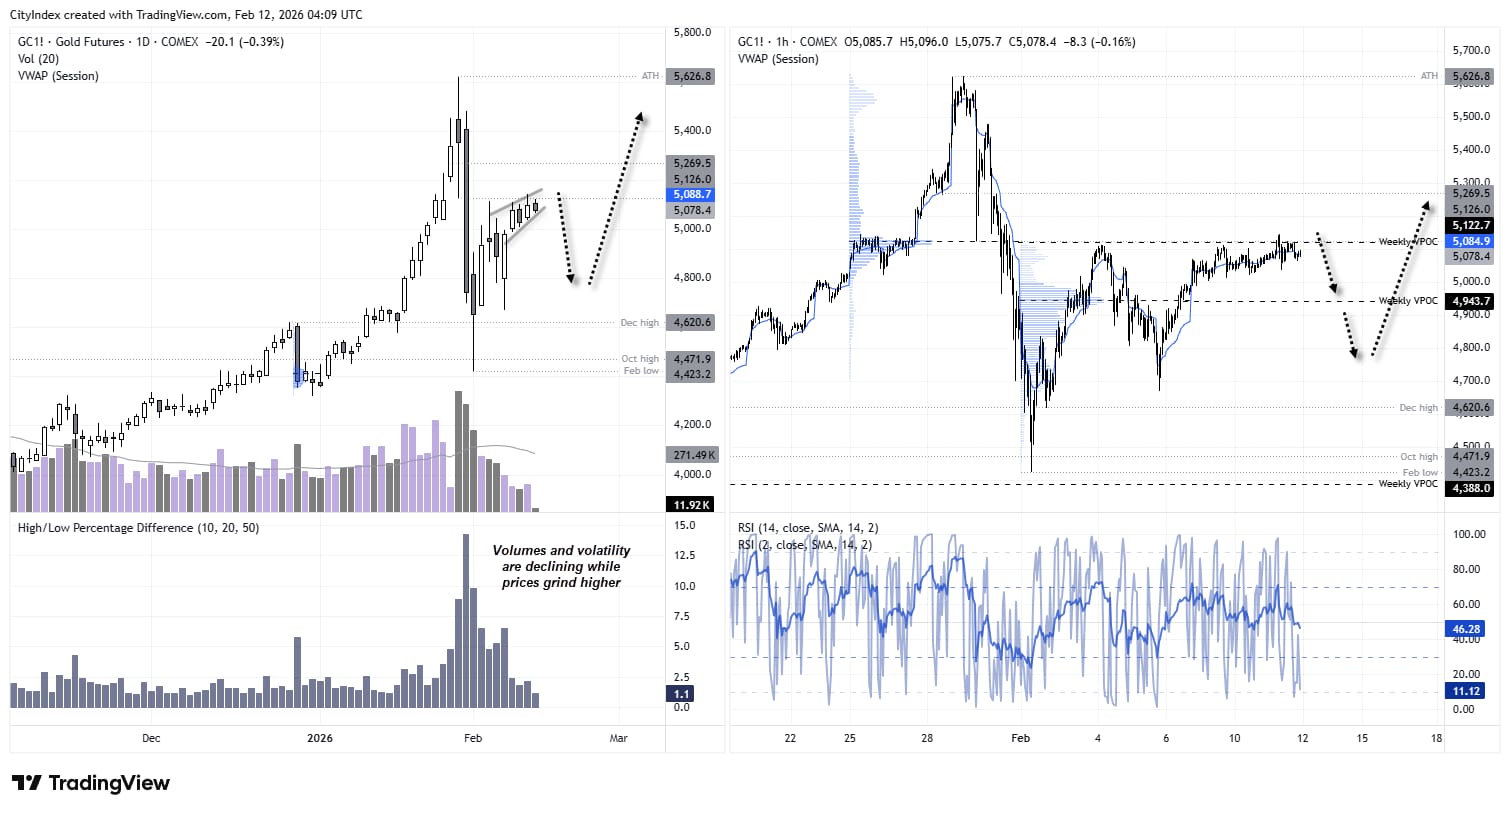
Gold bulls have enjoyed a 16.3% rebound from the February low. Yet volatility is clearly declining as prices rise, suggesting bulls may be running out of steam. Gold futures volumes have also fallen throughout the rally, hinting that a corrective move could be brewing.
However, a deeper correction would require gold to take out the February low and extend the decline from the all-time high. If that were to occur, it could suggest we are witnessing a classic dead-cat bounce.
Source: CFTC, COMEX, LSEG
Gold Pullback Levels: VPOC 4,943 and 4,800 Handle in Play
For now, my base case is that gold holds above the February low, although momentum may soften in the near term. I do not see a catalyst bearish enough to trigger another sharp leg lower, and futures positioning suggests the selloff was driven more by long capitulation than aggressive short initiation.
Notice that the rally has stalled around the low of the spinning top formed at the record high. Gold traders are clearly watching the 5,126 level, and a break above it could pave the way for a move towards 5,270. However, I will be on the lookout for a bearish reversal candle on the daily chart or a swing high on the intraday timeframes, targeting at least the weekly VPOC (4,943) or the 4,800 handle.
That said, I suspect bulls are waiting on the sidelines to buy such dips and rejoin the broader uptrend. If so, that could limit gold’s downside and keep prices comfortably above the February low near 4,400.

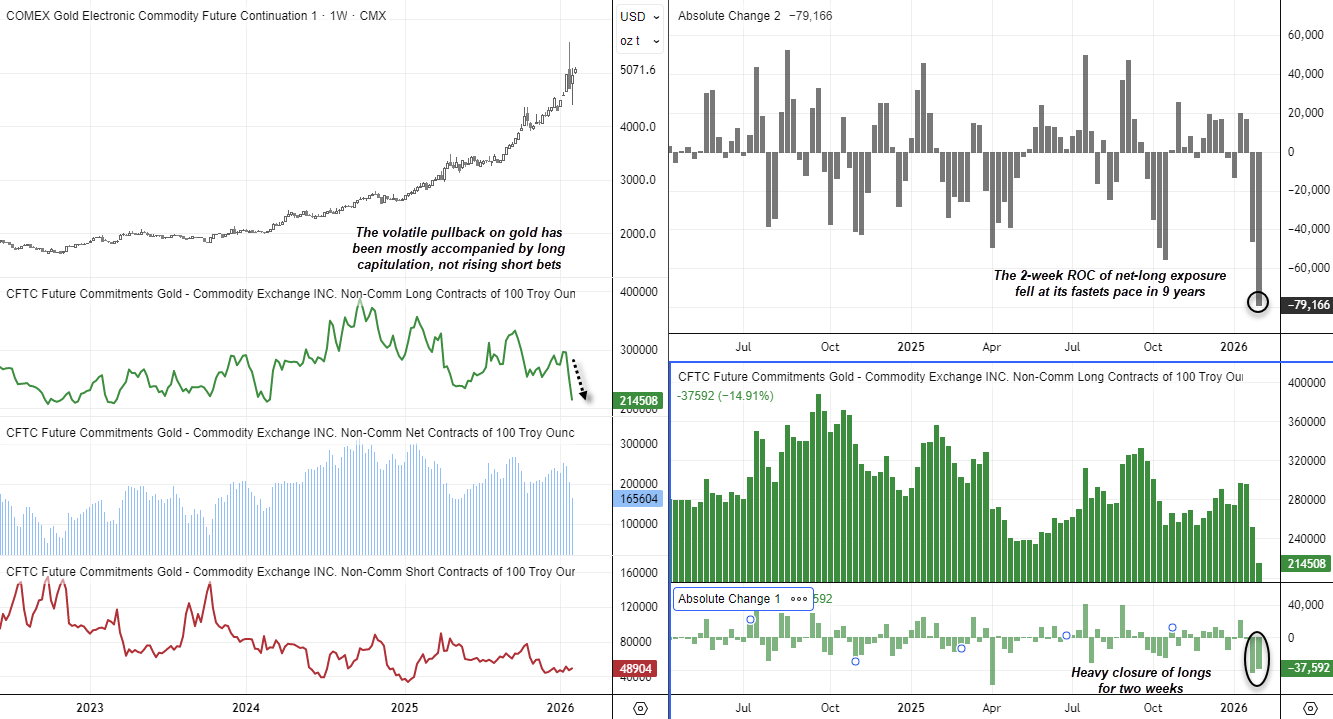
Gold Futures Positioning | COT Report
Futures traders have been relatively cautious on gold’s rally since net-long exposure peaked in September 2024. While bullish exposure began to rise as prices surged towards $5,000, there has been a notable wave of long covering now that prices have tumbled and volatility has spiked.
Net-long exposure has fallen by around 80k contracts over the past two weeks, marking its fastest two-week decline in nine years. While gross shorts have perked up slightly, they remain lower overall – highlighting that the selloff is predominantly a function of long liquidation rather than aggressive new short selling.
That could help keep a layer of support under gold prices, even if price action is beginning to hint at a deeper pullback.
Source: CFTC, COMEX, LSEG
View the full economic calendar
-- Written by Matt Simpson
Follow Matt on Twitter @cLeverEdge
How to trade with City Index
You can trade with City Index by following these four easy steps:
- Open an account, or log in if you’re already a customer
• Open an account in the UK
• Open an account in Australia
• Open an account in Singapore
- Search for the market you want to trade in our award-winning platform
- Choose your position and size, and your stop and limit levels
- Place the trade