
Gold Technical Forecast: XAU/USD Weekly Trade Levels
- XAU/USD plunged over 20% before rebounding nearly 10% off key support
- Gold is testing initial resistance with a break above 4671 needed to confirm a bottom
- Fed rate expectations shift hawkish as inflation risks rise on surging oil prices
- Safe-haven demand may return as equity weakness and geopolitical risks intensify
- Resistance 4533/40, 4671 (key), 4894– Support 4319, 4112 (key), 3934
Gold prices have staged an aggressive rebound after a steep multi-week selloff, with XAU/USD surging nearly 10% off recent lows to snap a three-week losing streak. The recovery comes after a more than 26% decline from the record high, with price responding to a key support zone near the October high-week close. While the bounce has helped stabilize near-term momentum, gold is now approaching critical resistance levels that could determine whether this move marks the start of a broader recovery—or merely a corrective rally within a larger downturn. Battle lines drawn on the XAU/USD weekly technical chart heading into April.
Gold Price Chart – XAU/USD Weekly
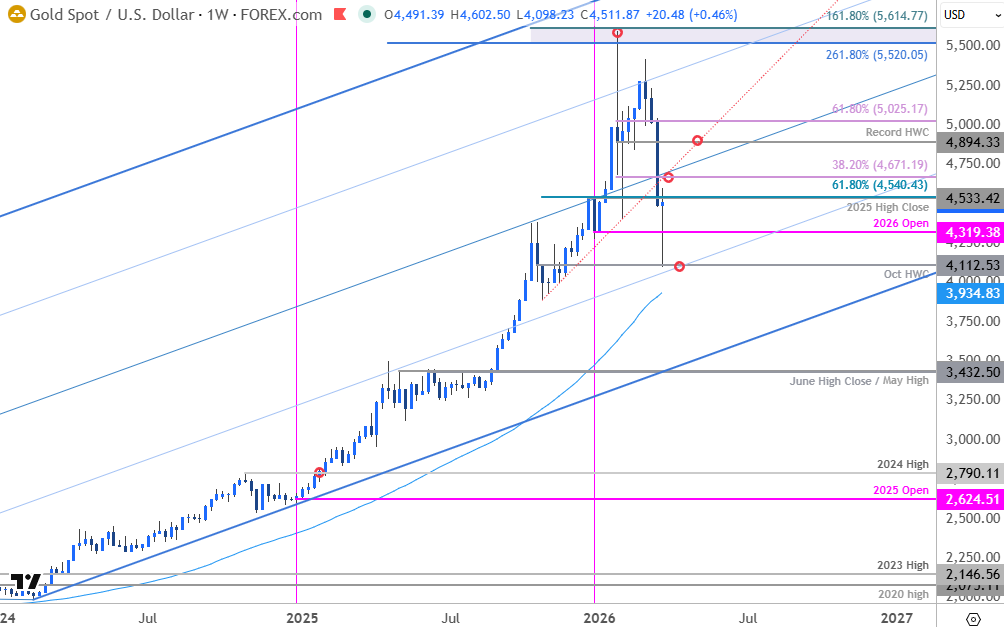
Chart Prepared by Michael Boutros, Sr. Technical Strategist; XAU/USD on TradingView
Technical Outlook: In my last Gold Technical Forecast we noted that XAU/USD, “remains capped by confluent resistance and while the broader outlook remains constructive, the immediate advance may be vulnerable while below the median-line. From at trading standpoint, the outlook remains unchanged and losses would need to be limited to 4894 IF price is heading higher on this stretch..” Gold plunged through support two-weeks later wit the decline extending more than 24% off the monthly high.
The selloff rebounded sharply off support this week at the October high-week close (HWC) near 4112 (intraday low registered at 4498) with the subsequent recovery rallying more than 9.9% off the low to close higher on the week. The advance snaps a three-week losing streak for gold with price closing the week just below initial resistance at the 20258 high-close and the 61.8% retracement of the October rally at 4533/40. Ultimately a breach / close above the 38.2% retracement of the decline off the record high at 4671 is needed to suggest a more significant low is in place. Note that the median-line and the October trendline converges on this threshold and gains passed this level would suggest a larger trend reversal is underway. Subsequent resistance objectives are eyed at the record high-week close (HWC) at 4894 and the 61.8% retracement at 5025. Look for a larger reaction there IF reached.
Initial support rests with the 2026 yearly open at 4319 backed by the 4112. Note that the 25% parallel converges on this level over the next few weeks and a break / weekly close below this slope would threaten another bout of losses towards the 52-week moving average near ~3934. Note that gold has not touched the yearly moving average since October of 2023- an area of interest for possible downside exhaustion / price inflection IF reached.

Keep in mind we get the release of key US economic data next week with ADP employment, retail sales, and Non-Farm Payrolls on tap into an extended holiday weekend. Markets will be closely eyeing any developments out of the Middle East with regards to negotiations with Iran for cues in the days ahead. Keep an eye on the headlines and stay nimble into the monthly cross. Watch the weekly closes for guidance here. Review my latest Gold Short-term Outlook for a closer look at the near-term XAU/USD technical trade levels.
Key US Economic Data Releases
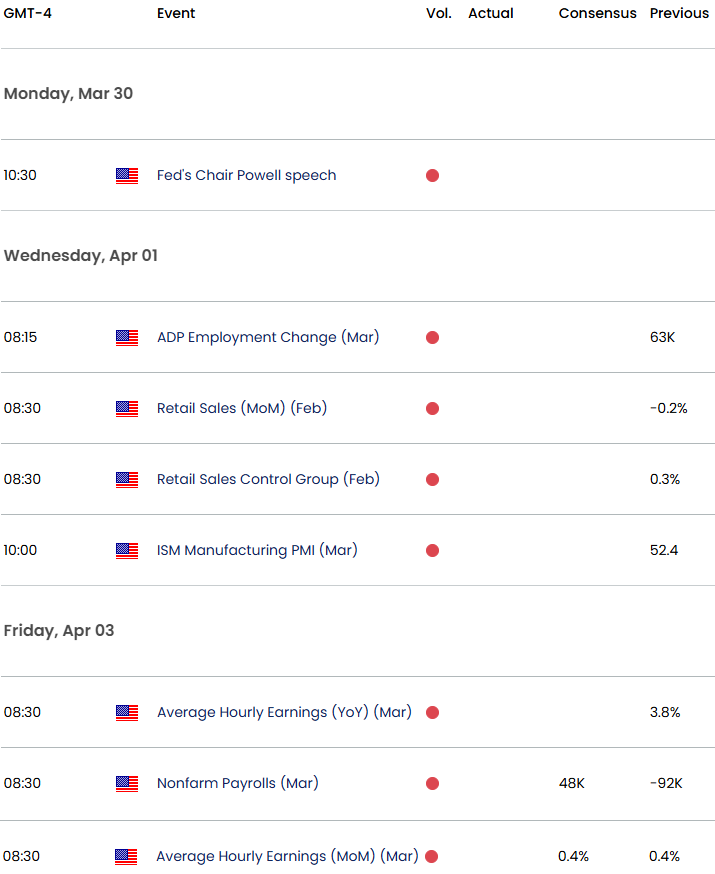
Economic Calendar - latest economic developments and upcoming event risk.
--- Written by Michael Boutros, Senior Technical Strategist
Follow Michael on X @MBForex