
Gold Technical Forecast: XAU/USD Weekly Trade Levels
- Gold reversed sharply after failing to secure a close above resistance following the Iran-driven spike.
- The pullback has erased more than 5% from the weekly high before stabilizing, ending a four-week winning streak.
- Momentum remains elevated on higher timeframes, but sustained weakness below key support would increase the risk of a broader corrective phase.
- Event risk ahead: US CPI & PCE
- Resistance 5342/43 (key), 5520-5615, 5768– Support 4894, 4791(key), 4533
Gold’s advance stalled after a brief geopolitical spike pushed prices into resistance, with the market reversing sharply earlier in the week before stabilizing into the close. Although XAU/USD has managed to recover part of the initial drop, the failure to secure a sustained break above resistance leaves the broader rally at an inflection point. With momentum stretched on higher timeframes and price now consolidating beneath a key ceiling, the focus shifts to whether buyers can reassert control or if the pullback extends into a deeper corrective phase. Battle lines drawn on the XAU/USD weekly technical chart.
Gold Price Chart – XAU/USD Weekly
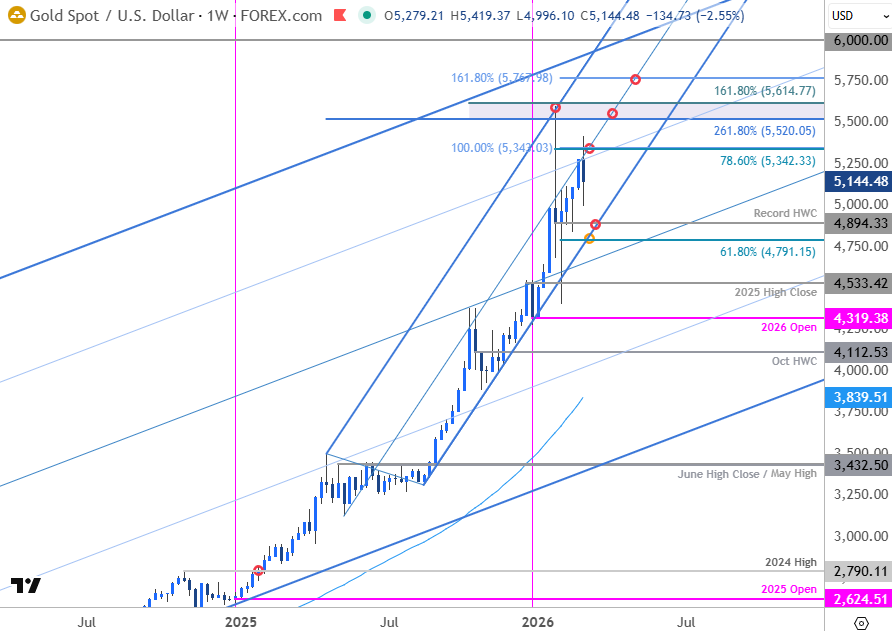
Chart Prepared by Michael Boutros, Sr. Technical Strategist; XAU/USD on TradingView
Technical Outlook: In last week’s Gold Technical Forecast we noted that, “A four-week rally is testing uptrend resistance into the close of the month. From a trading standpoint, losses would need to be limited to 4894 IF price is heading higher on this stretch with a close above 5343 needed to retest the record high.” Gold rallied into the start of the week as war broke out in Iran and despite briefly registering an intraday high at 5419, XAU/USD was unable to mark a daily close above resistance with price snapping a four-week winning streak to close nearly 2.5% lower- the largest weekly decline since the start of the year.
Gold dopped more than 5% off the weekly high before stabilizing and while momentum does remain in overbought condition, weekly RSI is now approaching the lowest levels of the year near 70. Watch this next week- the bulls will want to keep momentum elevated for the February rally to remain viable in the weeks ahead while a break back from overbought condition would threaten a larger pullback within the broader uptrend.
Initial support remains with the record high-week close at 4894 and is backed by the 61.8% retracement of the February rally at 4791. The lower parallel of the August pitchfork converges on this retracement next week and we’ll reserve this slope as our medium-term bullish invalidation level. A break of this formation would be needed to suggest a more significant high is in place and that a larger reversal is underway. Subsequent support is eyed at the 2025 high close at 4533.
Key resistance remains at 5342/43- a region defined by the 78.6% retracement of the decline off the record high and the 100% extension of the February advance. Note that the median-line converges on this threshold over the next few weeks and remains a key hurdle for the bulls. A breach / weekly close above this slope would threaten another test of the record high with topside resistance objectives eyed at the 2.618% extension of the December 2024 advance and the 1.618% extension of the August rally at 5520-5615 and the 1.618% extension at 5768.

Bottom line: Gold remains capped by confluent resistance and while the broader outlook remains constructive, the immediate advance may be vulnerable while below the median-line. From at trading standpoint, the outlook remains unchanged and losses would need to be limited to 4894 IF price is heading higher on this stretch with a close above 5343 needed to fuel the next leg of the advance.
Keep in mind we get another batch of inflation data next week with the February Consumer Price Index (CPI) and January Personal Consumption Expenditures (PCE) on tap. With the Friday’s Non-Farm Payroll report coming in far below expectations (-92K), the Fed is once again confronted between the threat rising prices and weaker labor growth and traders will be trying to assess the impact on the interest rate outlook. As of now, Fed Fund Futures are pricing a probability of just above 60 percent the next rate-cut will be in July. This has shifted dramatically on the heels of today’s labor report and inflation data next week may see further adjustment to the monetary policy outlook. Stay nimble into the releases and watch the weekly close for guidance here. Review my latest Gold Short-term Outlook for a closer look at the near-term XAU/USD technical trade levels.
Key US Economic Data Releases
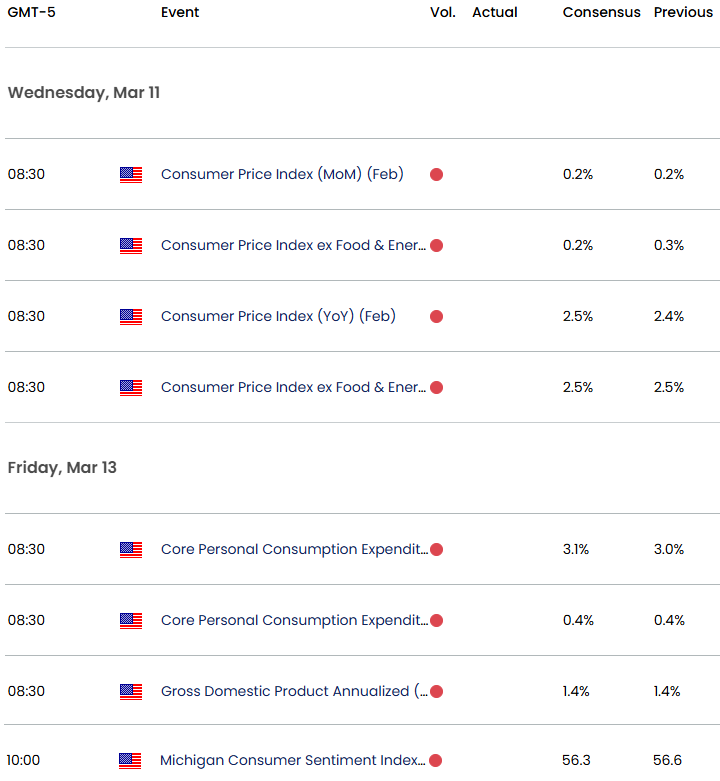
Economic Calendar - latest economic developments and upcoming event risk.
--- Written by Michael Boutros, Senior Technical Strategist
Follow Michael on X @MBForex