


Last week I warned that the grinding nature of gold’s rally was reminiscent of a dead cat bounce — a bearish pattern that can lure bulls into a false breakout before turning sharply lower. Given the article was published near last week’s high, the timing of gold’s subsequent selloff has proven fortunate.
Gold futures have since fallen 5.6%, with two of the past three sessions printing bearish engulfing candles. Momentum has clearly shifted in favour of sellers.
It now appears gold bears may attempt to drive prices towards the $4,800 support level. That zone could prove pivotal, acting as the line in the sand between a confirmed dead cat bounce and merely a shallow pullback within a broader, choppy consolidation phase.
View related analysis:
- Gold Outlook: Dead Cat Bounce Risk Builds Near Highs
- Gold and Silver Outlook: Whipsaws Persist, Bulls Look for a Bounce
- Dead Cat Bounce Explained: How False Rallies Form in Downtrends
- Nasdaq 100 Leads Risk-Off as Tech Earnings Weigh, Gold Slides
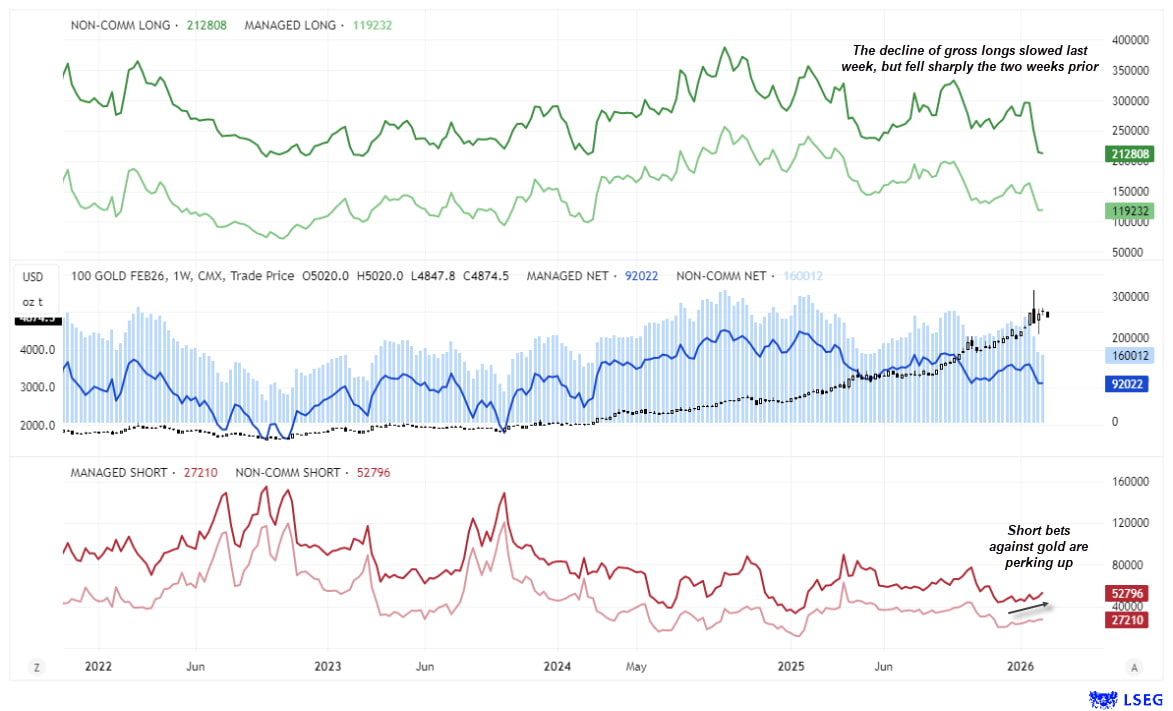
Gold Futures Positioning | COT Report
Short bets against gold futures are beginning to perk up. While still relatively low overall, gross shorts have been clearly trending higher in recent weeks among large speculators and managed funds. Net-long exposure has also fallen to a one-year low among large speculators.
Overall, this does not yet point to a major pullback for gold in my view, though I will be closely monitoring whether bears continue to build short exposure in the weeks ahead.
Source: CFTC (COT), COMEX, LSEG
Gold Futures (GC) Technical Analysis
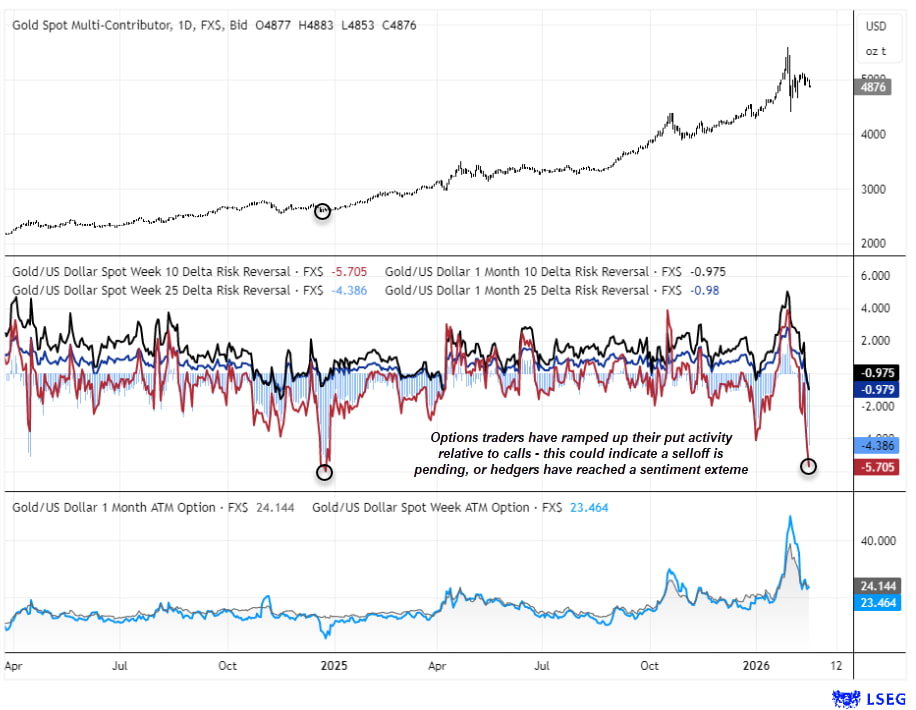
Gold Options Skew Signals Potential Sentiment Extreme in GC Futures
Options traders do not appear to be taking chances when it comes to gold. The 10-delta 1-week risk reversal – often used as a proxy for near-term tail risk – has fallen to its most negative level since December 2024. The 1-month 10-delta risk reversal has also flipped negative, signalling stronger demand for puts relative to calls. The 1-week and 1-month 25-delta risk reversals are tracking the same move lower as the 10-deltas.
This suggests options traders are either bracing for a downside move in gold prices, or that downside hedging has become stretched in the short term.
Given gold prices rallied the last time risk reversals were this negative, I am leaning towards hedging reaching a sentiment extreme rather than positioning for a sustained sell-off.
Source: COMEX, LSEG

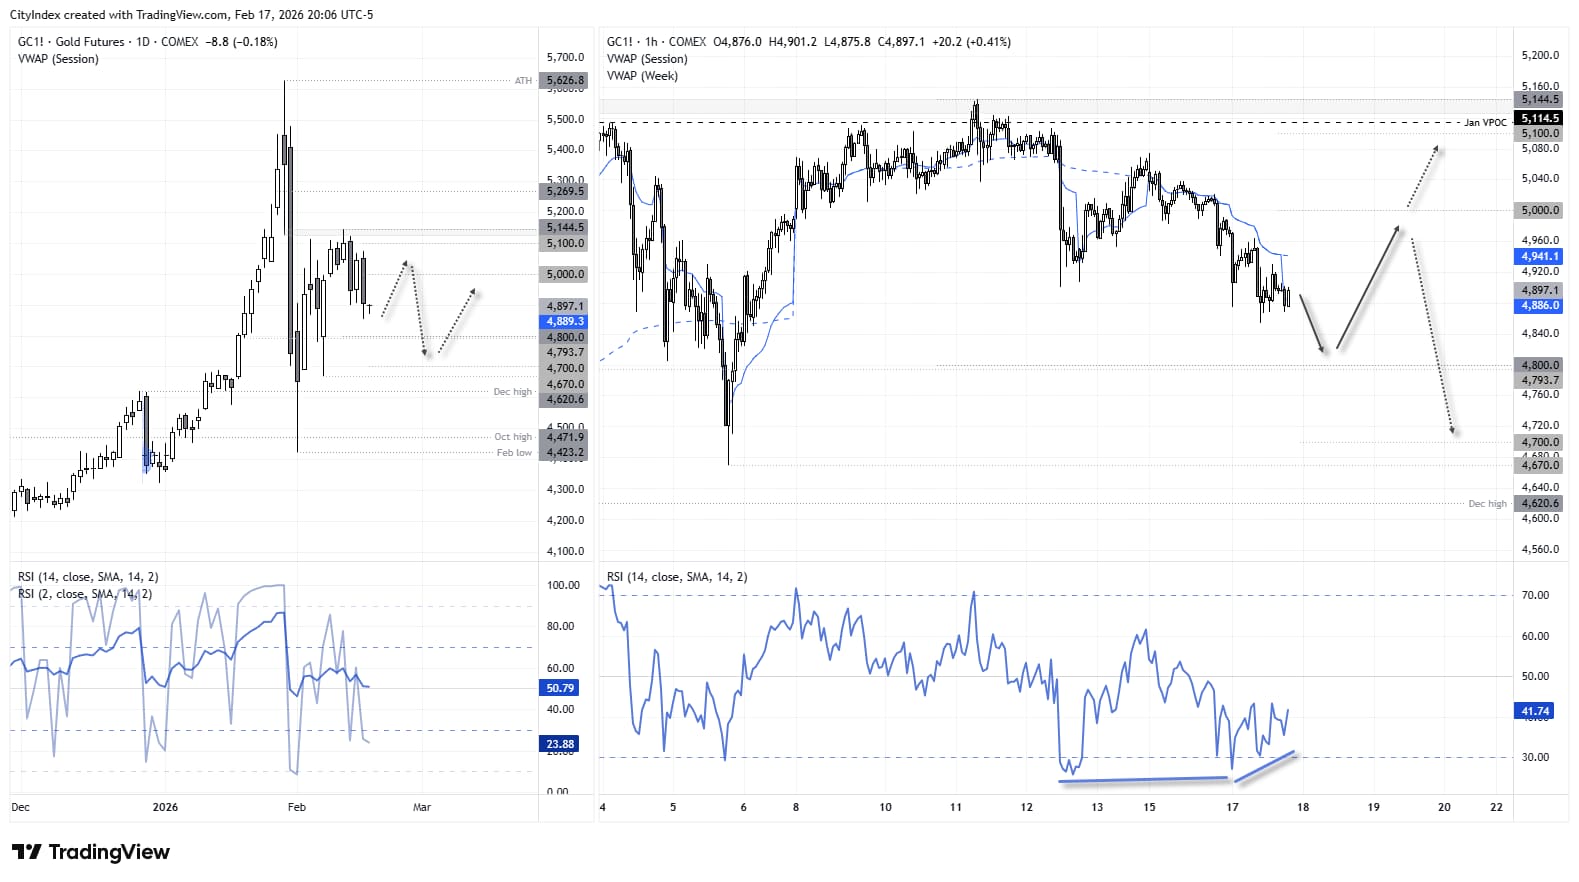
Gold Technical Outlook
The daily chart shows gold futures have formed two bearish engulfing candles since last week’s high. While this initially supported my dead cat bounce theory, I would have expected a far more aggressive sell-off by now to truly reflect the nature of such a bearish signal.
It appears bears may be attempting to drive gold futures towards the 4,800 area, though I suspect bulls may view that level as value.
The 1-hour chart shows two bullish divergences on the RSI (14), with lower wicks signalling hesitation to break lower immediately. However, with prices remaining beneath the weekly and daily VWAP, further lows remain plausible. The bias is for bulls to buy dips above 4,800 and attempt another move towards 5,000 in the near term — a break above which brings the 5,140 highs into focus.
That said, I also suspect bears may fade rallies towards 5,000 to contain upside momentum, potentially keeping gold in a choppy 4,800–5,100 range for now.
Source: COMEX, LSEG
View the full economic calendar
-- Written by Matt Simpson
Follow Matt on Twitter @cLeverEdge
How to trade with City Index
You can trade with City Index by following these four easy steps:
- Open an account, or log in if you’re already a customer
• Open an account in the UK
• Open an account in Australia
• Open an account in Singapore
- Search for the market you want to trade in our award-winning platform
- Choose your position and size, and your stop and limit levels
- Place the trade


