


Gold Technical Outlook: XAU/USD Short-term Trade Levels
- XAU/USD rallied more than 23% from the February low before stalling at technical resistance
- The 7% pullback from recent highs brings price back toward initial retracement support, and the first real test for the bulls.
- Resistance 5279, 5343/378 (key), 5520-5615- Support 5031, 4894, 4791 (key)
Gold’s powerful rebound from February lows has lost momentum after failing to sustain a move beyond technical resistance. The decline takes price into initial support, and a reaction here could determine whether the advance was simply overextended or whether a more meaningful pullback is developing. With volatility elevated amid the ongoing war in Iran and momentum stretched on higher timeframes, the next move from this zone carries outsized importance. A decisive defense by buyers would keep the broader uptrend intact, while continued weakness could mark the beginning of a more prolonged consolidation phase. Battle lines drawn on the XAU/USD short-term technical charts.
Gold Price Chart – XAU/USD Daily
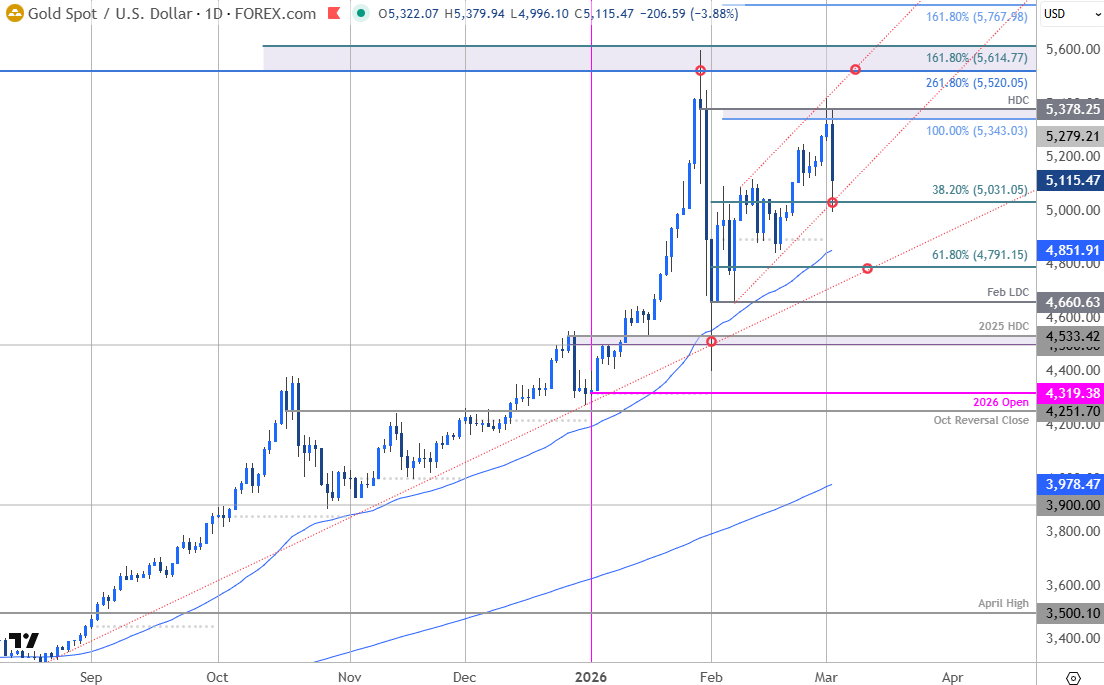
Chart Prepared by Michael Boutros, Sr. Technical Strategist; XAU/USD on TradingView
Technical Outlook: In last month’s Gold Short-term Outlook we noted that XAU/USD was, “in consolidation after last month’s massive selloff and prices could remain sideways here for the next few weeks before asserting the next move. From a trading standpoint, losses should be limited to 4500 for the broader uptrend to remain viable with a breach / close above 5343 needed to suggest a more significant low is in place and threaten another run at the highs.” Price has rallied more than 23% off the February low and despite registering an intraday high at 5419 yesterday, the bulls were unable to mark a close above 5343. The subsequent reversal has plunged more than 7.8% off the monthly high with price trading into initial support today and the focus is on possible inflection off this level in the days ahead.
Interestingly, gold has not benefited from the recent risk sell-off and suggests that the market needs further time to digest the late-January washout. Last month we noted the last two significant pullbacks (April -10.8% and October -11.3%) held the decline range for at least two-month before resumption and we could be in for a few more weeks of chop here. Note that weekly momentum has been in overbought territory since September and a break below 70 in weekly RSI would suggest a shift in the momentum profile.
Gold Price Chart – XAU/USD 240min
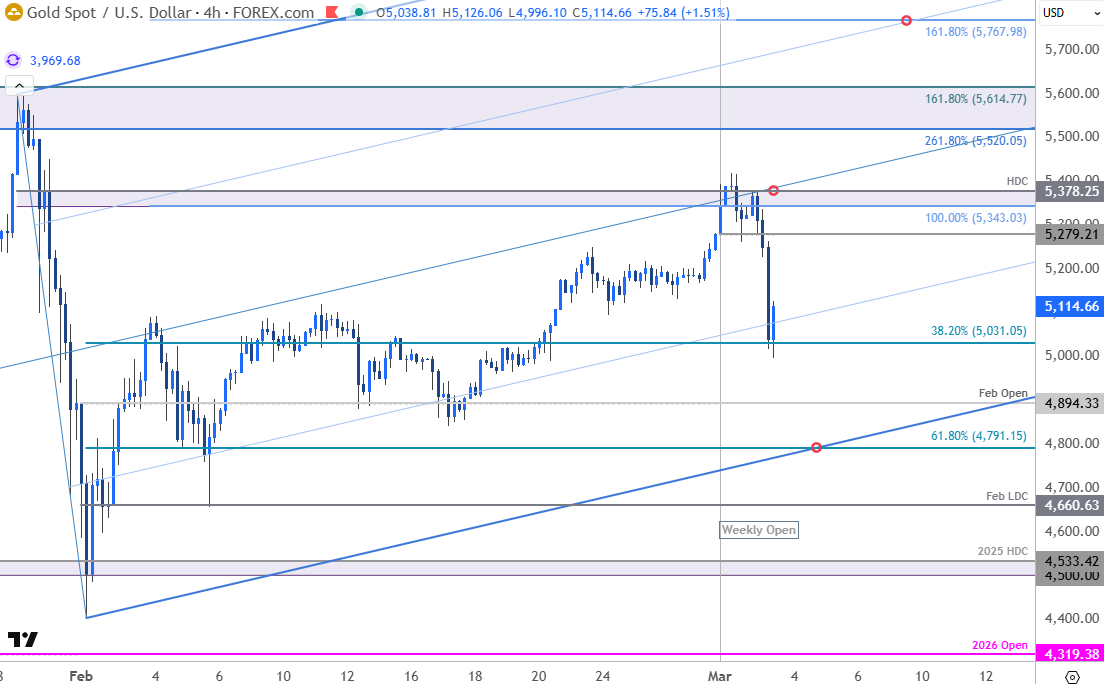
Chart Prepared by Michael Boutros, Sr. Technical Strategist; XAU/USD on TradingView
Notes: A closer look at gold price action shows XAU/USD continuing to trade within the confines of an ascending pitchfork extending off the February low with the median-line further highlighting initial resistance at 5343/78- a region defined by the 100% extension of the February advance and the record high-day close (HDC). The pullback is now testing the 38.2% retracement of the February advance at 5031. A break below this level would expose the February open at 4894 with near-term bullish invalidation now raised to the 61.8% retracement at 4791. Note that the lower parallel converges on this level over the next few days and losses below this slope would suggest a more significant correction is underway. Subsequent support seen at the February low-day close (LDC) at 4660 and the 2025 high-day close at 4533.
Weekly open resistance is eyed at 52749 with a break of the monthly highs needed to fuel another run at the record highs. Key resistance remains at 5520-5615- a region defined by the 2.618% extension of the broader December 2024 advance and the 1.618% extension of the August rally. A daily close above this pivot zone would mark resumption of the multi-year uptrend with subsequent resistance objectives eyed at the 1.618% extension at 5768 and 6K.

Bottom line: Today’s gold decline is threatening to mark an outside-weekly reversal off resistance at multi-week highs. The risk remains for further losses near-term within the February uptrend. From a trading standpoint, losses should be limited to 4791 IF price is heading higher on this stretch with a close above 5378 needed to fuel the next major leg of the advance.
Keep in mind that the Iran war has triggered a surge in oil prices and the potential impact on inflation are profound. Friday’s Non-Farm Payroll report will be critical as traders continue to push out expectations for future Fed rate cuts with the next cut now expected in July. A stronger-than-expected jobs report could further exacerbate this shift and keep the central bank on hold as the inflation outlook becomes more uncertain. Stay nimble into the release and watch the weekly close here for guidance. Review my latest Gold Weekly Technical Forecast for a closer look at the longer-term XAU/USD trade levels.
Key Economic Data Releases
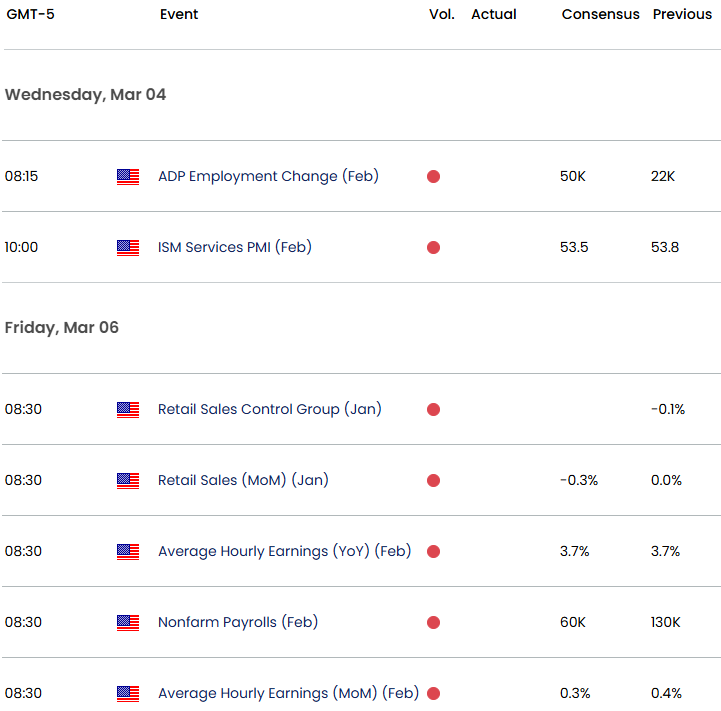
Economic Calendar - latest economic developments and upcoming event risk.
--- Written by Michael Boutros, Senior Technical Strategist
Follow Michael on X @MBForex


