
Gold Technical Outlook: XAU/USD Short-term Trade Levels
- Gold prices go from washout to whipsaw – a plunge of more than 20% from the record high has recovered over 15% from the February low with resistance now in view.
- Previous corrections suggest consolidation could last for weeks- breakout needed to clarify whether this phase resolves into continuation or a broader corrective range.
- Resistance 5142, 5343 (key), 5520-5615- Support 4894, 4660/66, 4500/33 (key)
Gold is entering a consolidation phase following an extraordinary sequence of price swings, marked by a powerful rally, a record-breaking decline, and a swift recovery from the February lows. Price action has since compressed into a narrow range, suggesting the market may need time to absorb the recent volatility before committing to the next directional move. With XAU/USD now pressing into a well-defined resistance area within an ascending structure, attention turns to how this consolidation resolves. A decisive break from this range is likely to provide the clearest signal on whether gold resumes its broader advance or extends into a more prolonged corrective phase. Battle lines drawn on the XAU/USD short-term technical charts.
Gold Price Chart – XAU/USD Daily
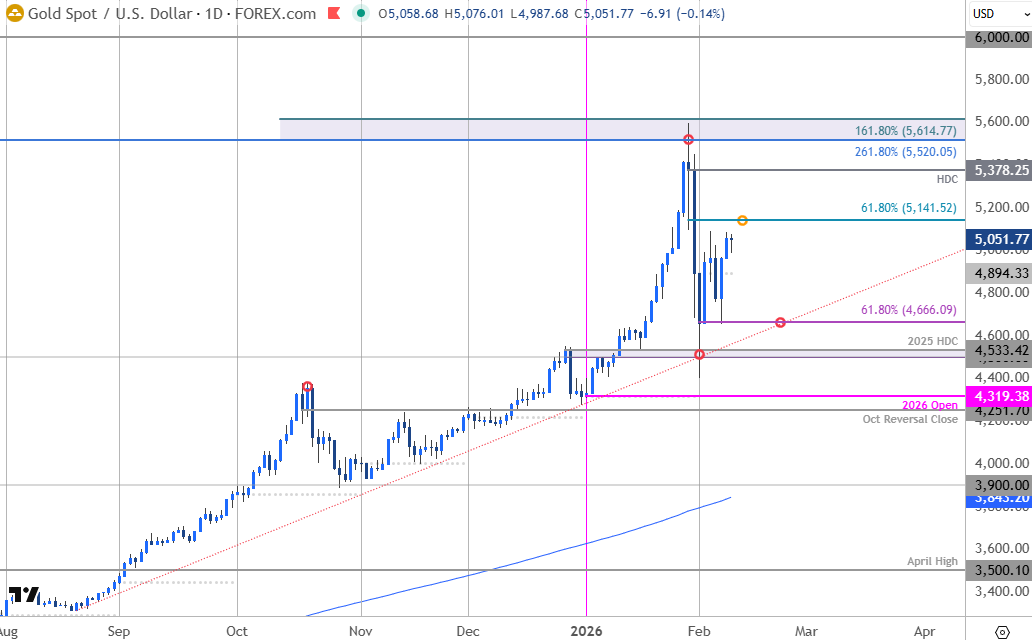
Chart Prepared by Michael Boutros, Sr. Technical Strategist; XAU/USD on TradingView
Technical Outlook: In last month’s Gold Short-term Outlook we noted that XAU/USD approaching resistance and that, “From a trading standpoint, losses would need to be limited to 4900 IF price is heading higher on this stretch with a close above 5K needed to fuel the next leg of the rally.” Gold broke higher the following day with the rally extending nearly 30% off the January low before exhausting into confluent resistance at 5520-5615- a region defined by the 2.618% extension of the broader December 2024 advance and the 1.618% extension of the August rally.
Gold marked the largest single-day decline in history the following day with XAU/USD plunging more than 21% off the high before exhausting near 4500 into the February open. The subsequent recovery has extended more than 15.5% off the monthly low with XAU/USD now approaching Fibonacci resistance at the 61.8% retracement of the most recent decline at 5142. Looking for possible inflection off this level in the days ahead IF reached.
It is worth noting that gold is likely to remain rangebound for some time as the markets digest this recent washout. The last two significant pullbacks (April -10.8% and October -11.3%) held the decline ranges for more than a month before resumption and we could be in for a few more weeks of chop here.
Gold Price Chart – XAU/USD 240min
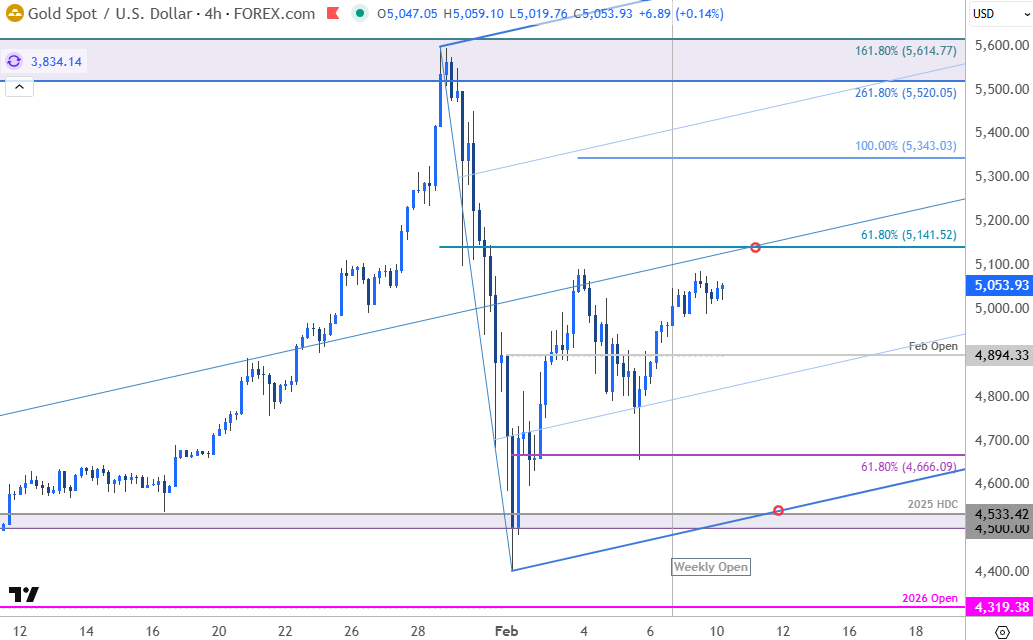
Chart Prepared by Michael Boutros, Sr. Technical Strategist; XAU/USD on TradingView
Notes: A closer look at gold price action shows XAU/USD trading within the confines of an ascending pitchfork extending off the monthly low with the median-line further highlighting initial resistance near 5142. The initial weekly opening-range is extremely tight – look for a breakout to offer guidance here. A topside breach above the median-line would expose the 100% extension of the advance off the monthly low at 5343- strength beyond this level would suggest a more significant low is in place and dispel the notion of this recovery being a simple correction within a larger decline. A close above 5615 will ultimately be needed to fuel the next major leg of the gold advance toward 6K.
Monthly open support rests at 4894 and is backed by the February low-day close and the 61.8% retracement of the February range at 4660/66. Key support rests with the 2025 high-day close (HDC) at 4500/33 and losses beyond this zone would suggest a larger correction is underway. Subsequent support rests with the objective yearly open at 4319.

Bottom line: Gold is in consolidation after last month’s massive selloff and prices could remain sideways here for the next few weeks before asserting the next move. From a trading standpoint, losses should be limited to 4500 for the broader uptrend to remain viable with a breach / close above 5343 needed to suggest a more significant low is in place and threaten another run at the highs.
Keep in mind we get the release of the December Non-Farm Payroll report tomorrow with consensus estimates calling for a print of 70K jobs while unemployment steadies at 4.4%. For gold, the latest Consumer Price Index (CPI) on Friday may be the most impactful data print this week as traders attempt to gauge the Fed’s willingness to cut rates. Fed Fund Futures are currently pricing a 76% probability the first-rate cut will be delivered in June. Stay nimble into the release and watch the weekly closes for guidance here. Review my latest Gold Weekly Technical Forecast for a closer look at the longer-term XAU/USD trade levels.
Key Economic Data Releases
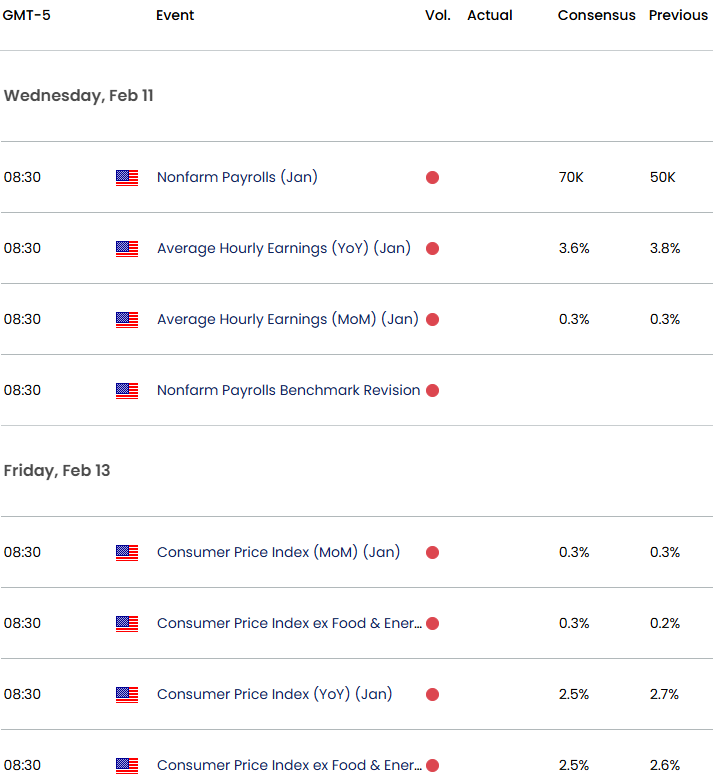
Economic Calendar - latest economic developments and upcoming event risk.
--- Written by Michael Boutros, Senior Technical Strategist
Follow Michael on X @MBForex