
- No end in sight to Hormuz disruptions
- Crude spikes as estimated 15m bpd stays offline
- Gold, S&P 500 hammered as earlier gains unwind fast
- Inflation and growth risks rise together, leaving policymakers wedged
Hormuz risk repriced
US President Donald Trump, in a televised address updating not only the American people but the world on the progress of Operation Epic Fury, said the US was close to achieving its objectives in Iran, but offered no clear timeline for de-escalation, instead signalling strikes would continue for another two to three weeks and leaving the door open to further escalation, including targeting energy infrastructure.
The core issue for markets was the Strait of Hormuz, with no clarity on when or how it would reopen, leaving a major portion of global energy supply effectively stranded and forcing traders to price a prolonged disruption rather than a near-term resolution.
The lack of clarity has already hit risk appetite hard, with markets rushing to reprice the risk of a sustained supply shock.
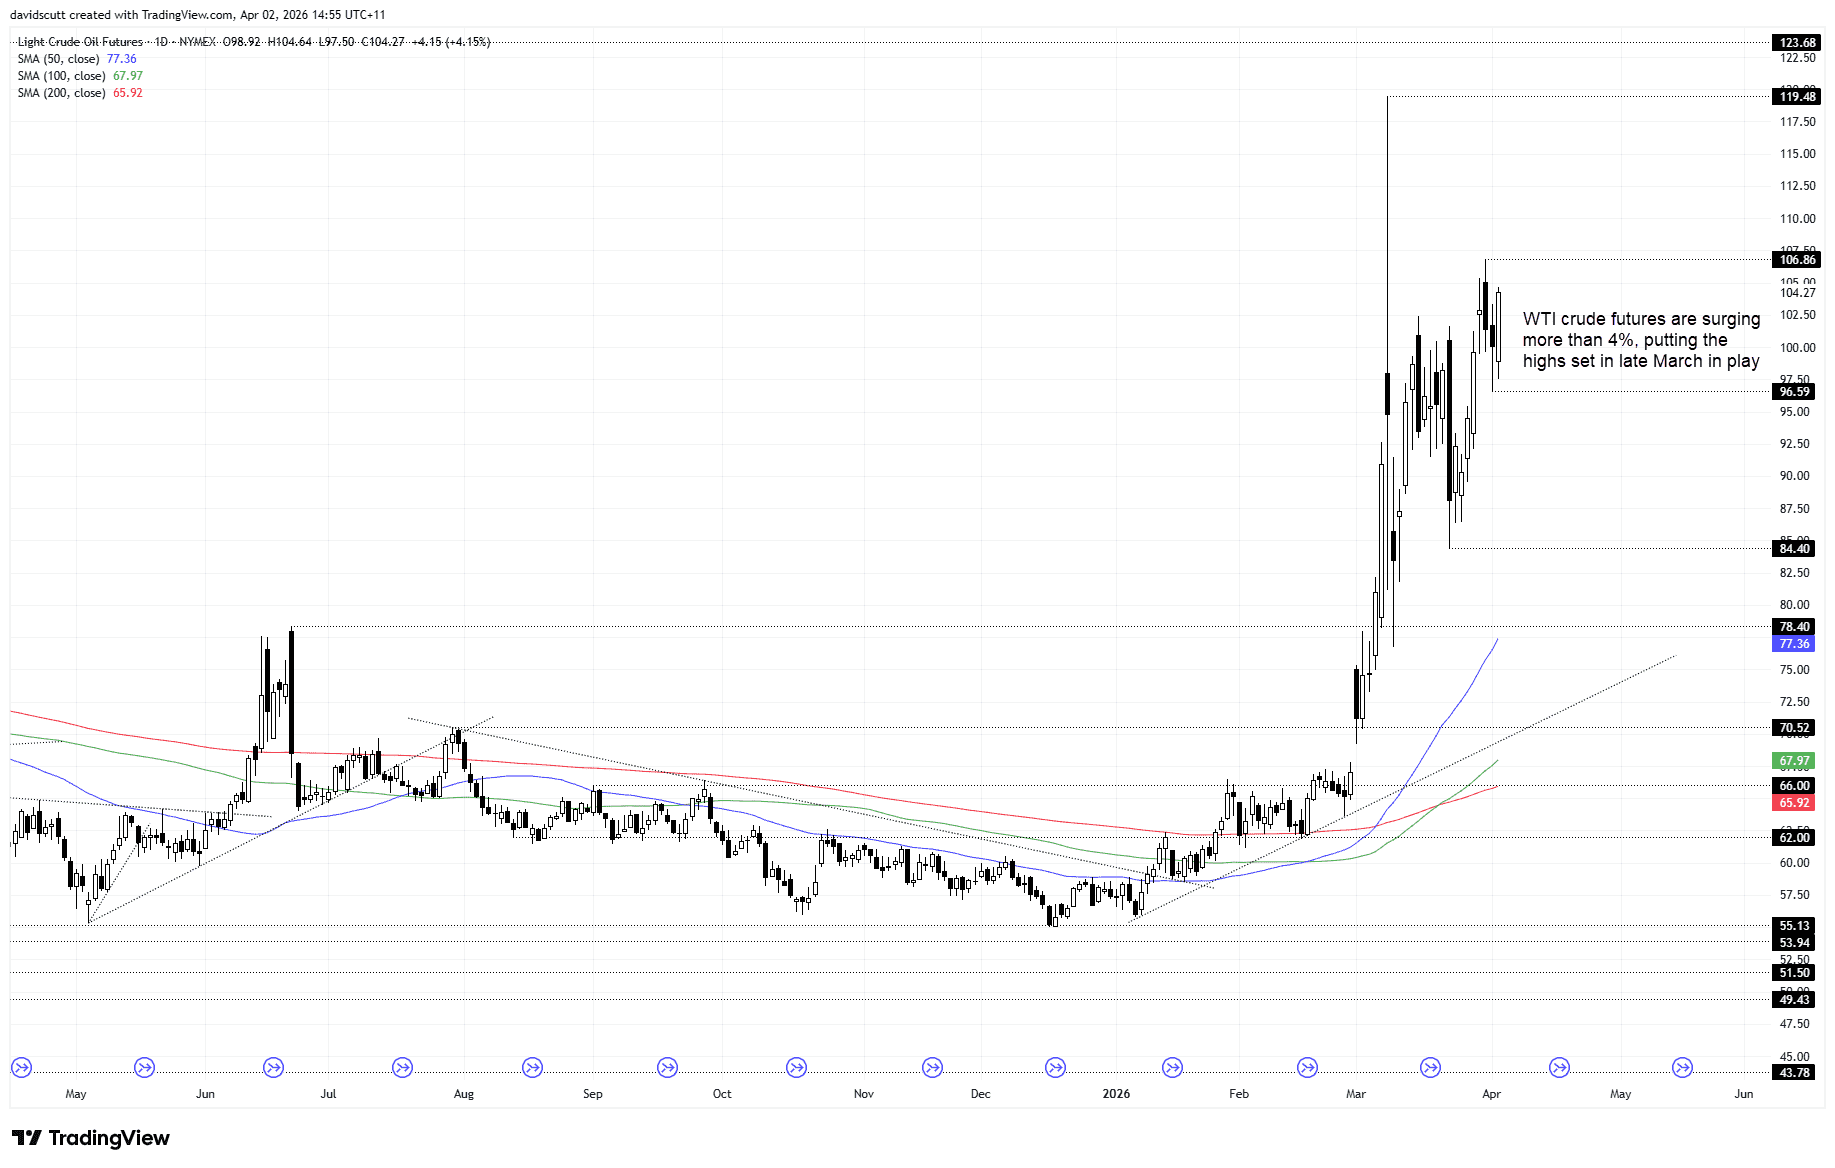
Source: TradingView
Crude has spiked, precious metals have slumped, equities have cascaded lower, reversing earlier gains seen before Trump spoke, while the USD and bond yields have pushed higher. According to some estimates, around 15 million barrels per day have been lost due to disruptions through the Strait of Hormuz. As such, total supply lost is now close to 500 million barrels since the conflict began, a meaningful chunk removed from the global system, tightening inventories and lifting the risk of shortages.
The macro problem is straightforward. This is both an inflation and growth shock at the same time, leaving policymakers with limited ability to respond forcefully. Higher energy costs push inflation higher, but they also erode demand and slow activity.
By effectively telling the world to source oil elsewhere, including from the US, a structural risk premium is now being embedded into energy prices for the foreseeable future.
With that in mind, the moves in gold and the S&P 500 reflect a deteriorating macro environment in the period immediately following Trump’s address.
Gold under pressure at support zone
Source: TradingView
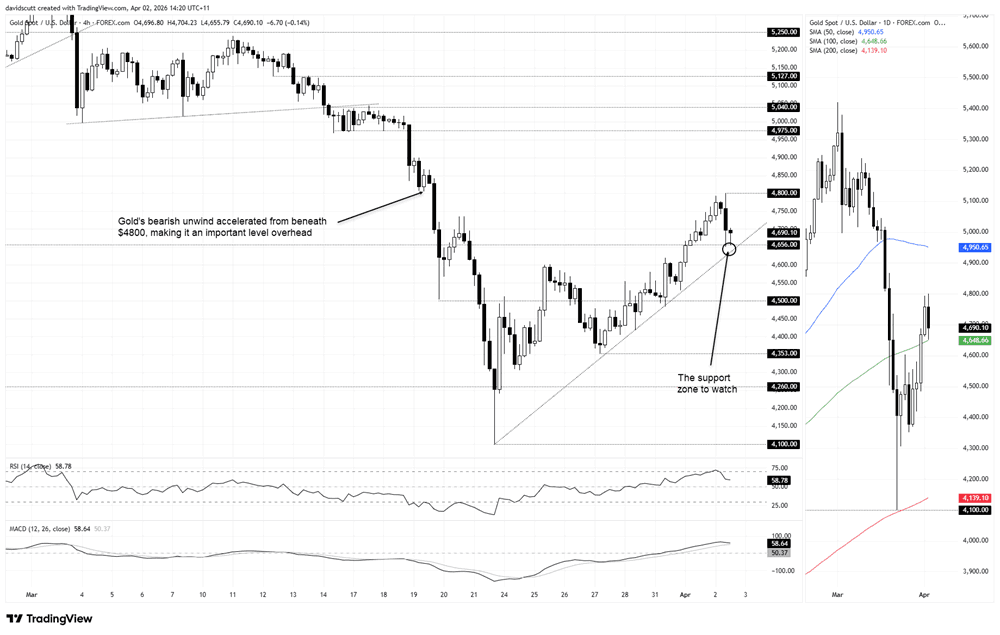
Gold has behaved more like a risk asset than a haven following Trump’s address, with the price reversing lower to test $4656, the low from February 6 that triggered a sizeable bounce. That level has already been tested twice on the H4 and held, but in the current environment, it may well come under pressure again.
Just beneath sits the 100DMA at $4648, visible on the daily chart, aligning with the uptrend from the June lows. Together, they form a key support zone for traders to watch closely.
If the zone holds, longs could be considered above $4656, with a stop beneath either that level or the March uptrend depending on risk tolerance, targeting a move back towards $4800, which stands out as a key near-term level overhead marking the point where the sharp leg lower in March began. The rejection there earlier in the session reinforces its importance, with $4900 a secondary reference above before former support at $4975 comes into view.
If the zone gives way on a clean break, shorts could be considered with a stop above the trendline for protection, targeting $4500 initially, with $4600 a reference point in between. A break below $4500 would shift focus to the March 27 low at $4353.
Momentum is starting to soften on the H4. RSI (14) sits marginally above 50 after easing from overbought territory, while MACD is curling back towards the signal line and looks close to a crossover. It’s more a cautionary signal for bulls than a clean trigger for shorts, but in this environment, downside risks could materialise quickly.
S&P 500 back to 6500 battleground
Source: TradingView
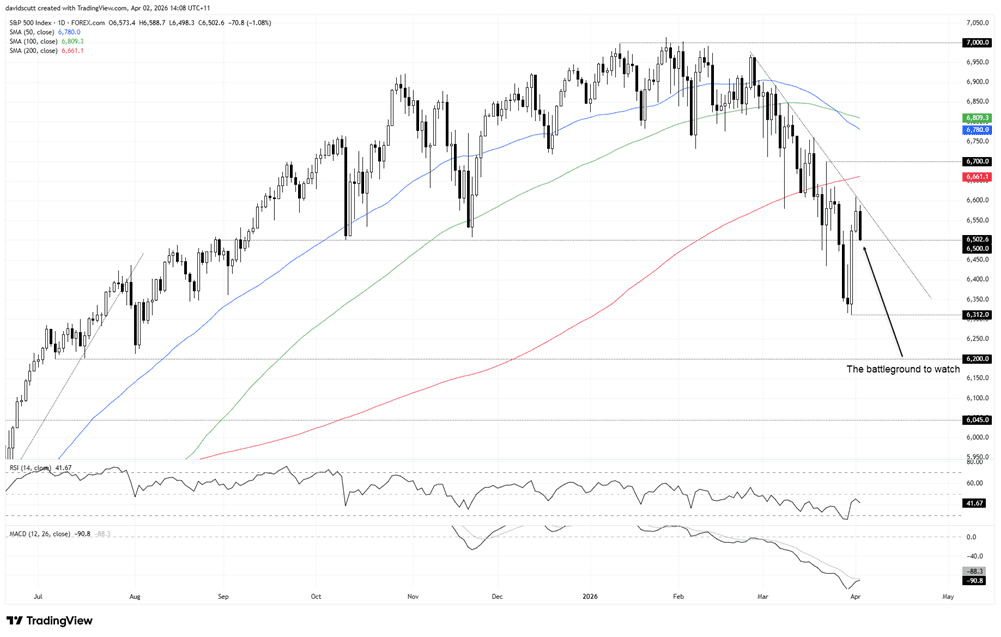
The S&P 500 may have seen a corrective bounce, but the broader bearish structure it has been sitting in since March remains intact. The price kissed the March downtrend earlier in the session and was again rejected, sending it back towards the key 6500 level.
As the chart shows, the price has regularly found support beneath this level since October last year, bouncing from below it on several occasions before finally closing beneath it on March 26, ushering in the unwind that saw the index bottom at 6312 before rebounding into month-end.
6500 is the level to watch for anyone considering setups. If we were to see a sustained break beneath it, preferably on a closing basis, it would present a decent short entry zone, allowing for stops to be set above while targeting the March lows. In between, 6437 saw some price action recently, making it a reference point of note.
If 6500 holds, longs could be considered above with a stop below for protection, targeting a move back towards the March downtrend. A sustained break above that would open the door for a run towards the 200DMA at 6661, breaking the bearish structure in the process. 6700 sits above as another target, with the confluence of the 50 and 100DMA an additional zone to watch.
Given the signals from the oscillators and the negative slope on the 50 and 100DMA, selling into strength is preferred until the March downtrend is broken. That would even up directional risks, providing a more balanced bias when assessing setups.