


Gold is on track for a second consecutive weekly decline from its record high — its first such bearish sequence in more than four months. Prices have slipped below $4,000, but the question now is whether they can recover over the near term. With Jerome Powell not signalling another 25bp Fed cut in December, gold may be able to find some stability.
If US data continues to improve, we could even see gold rise alongside the US dollar. That could keep gains on gold capped to a degree, but given how gold rebounded following a brief dip below $3,000 earlier this year, traders should remain alert for a potential short-term bounce.
View related analysis:
- Gold Suffers Fifth Worst-Day Drop in 55yrs As Momentum Trade Unwinds
- Gold Volatility Perks Up At $4k, Though Pullbacks Could Be Limited
- US Dollar Leads FX Majors After Hawkish FOMC: USD/JPY, AUD/USD in Focus
- Bitcoin Bounce Fails to Shake Bearish Outlook
Gold Futures Eye Modest Rebound as Options Market Turns More Bullish
Gold Bulls May Not Give Up Just Yet
The weekly futures chart shows that gold saw a single weekly close below $3,000 before continuing higher. While this week’s candle is yet to close, prices are already trying to recover back above $4,000 — and a close around $4,030–$4,040 by Friday could form a bullish hammer on this timeframe. Ultimately, $4,000 remains a key level, and I don’t see gold bugs giving up that easily — even if a deeper correction seems likely before gold pushes on to new highs.
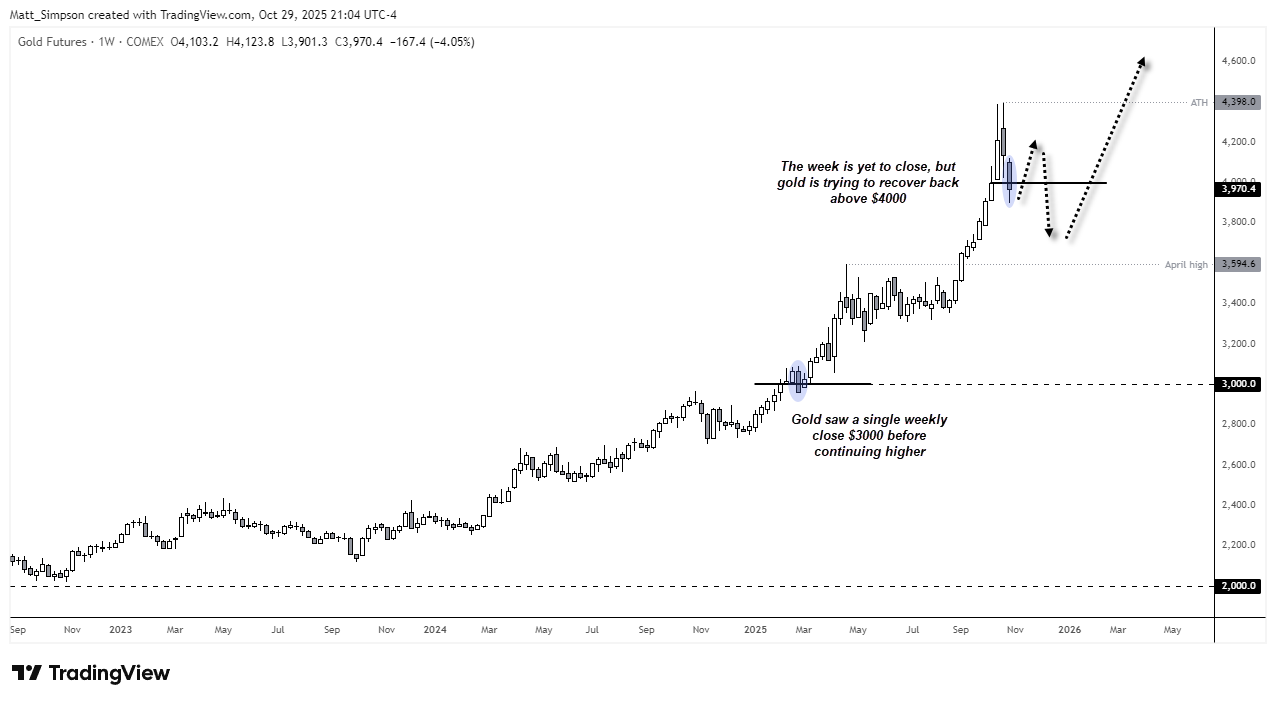
Chart analysis by Matt Simpson, Source: TradingView, COMEX Futures, Gold

Options Hint At Higher Gold Prices
Positioning in the gold options market also warrants attention. The 25-delta risk reversals over the 1-week and 1-month periods have been trending higher for the past week and a half. This indicates increased buying pressure, as risk reversals reflect the difference between put demand (bearish bets) and call demand (bullish bets). Rising RRs suggest that call demand is outpacing puts — and given gold has been moving lower for seven consecutive sessions, bears may want to take note.
Implied volatility has also perked up slightly and remains elevated relative to its historical norm. For now, a rebound above $4,000 appears likely for gold, though I’ll also be watching for signs of a swing high — or a lower high — on the daily chart to anticipate an eventual leg lower.

Chart analysis by Matt Simpson - Source: COMEX, LSEG

Gold Futures (GC) Technical Analysis
Gold has now declined 11.3% from its record high, having stalled just $2 shy of the $4,400 handle. Bearish momentum is beginning to fade, with a small bullish hammer forming on Tuesday alongside the highest daily volume in four days — hinting at a potential shift in control from bears to bulls. A modest bullish candle followed on Wednesday, holding above the hammer’s low, while the 50-day EMA (3,876) and weekly VPOC (3,891) provide nearby potential support levels.
Given the improving options positioning and waning downside momentum, bulls may look to buy dips towards recent cycle lows and maintain a short-term bullish bias while prices hold above the 50-day EMA. I remain cautious on the likelihood of a move back to $4,100 if the US dollar continues to strengthen, but that level — near another weekly VPOC — remains a plausible upside target should conditions allow.
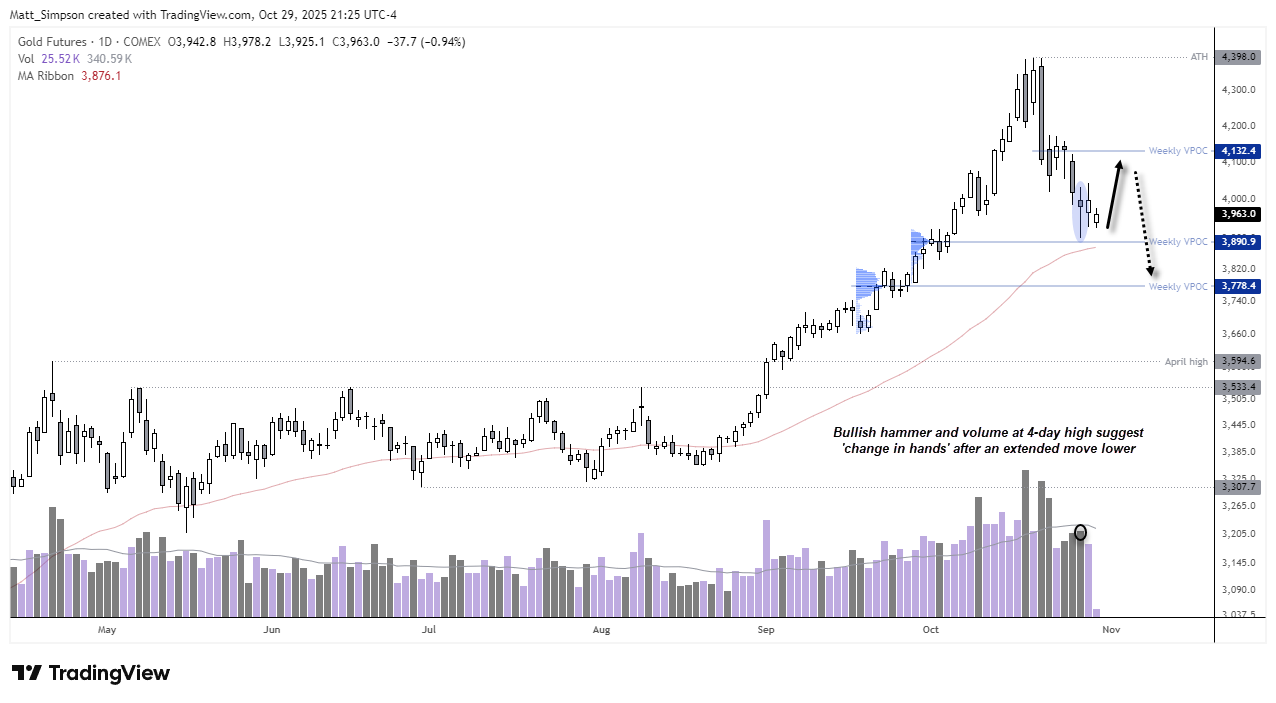
Chart analysis by Matt Simpson, Source: TradingView, COMEX Futures, Gold
View the full economic calendar
-- Written by Matt Simpson
Follow Matt on Twitter @cLeverEdge
How to trade with City Index
You can trade with City Index by following these four easy steps:
- Open an account, or log in if you’re already a customer
• Open an account in the UK
• Open an account in Australia
• Open an account in Singapore
- Search for the market you want to trade in our award-winning platform
- Choose your position and size, and your stop and limit levels
- Place the trade


