


Gold’s meteoric rise to $4,000 has been well documented, but volatility has finally returned near the highs — which could leave some traders hesitant to rejoin the trend immediately. That could translate into choppy price action around current levels before gold either retraces or resumes its advance.
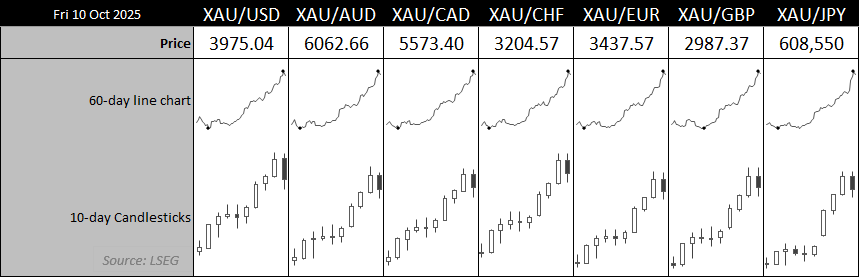
Chart analysis by Matt Simpson - Source: LSEG
View related analysis:
- Gold Outlook: Rising Implied Volatility on Path to $4000
- Japanese Yen Selloff Losing Steam, AUD/JPY and AUD/USD Bears Resurface
- US Dollar Rebound Appears Corrective, EUR/USD And GBPUSD Set To Bounce?
- AUD/USD Q4 Outlook: Bears Target Slower Growth, RBA Cut
Gold’s 60-day line charts against FX majors highlight how relentless the rally has been, with barely a pause or pullback on the daily timeframe. However, Thursday’s futures session against the US dollar stood out as the most volatile day in five months — and notably, the highest volume day in six — suggesting initiative selling rather than simple long liquidation. Moreover, with gold failing to close within its upper Keltner band for the past month, the case for a proper mean-reversion phase is strengthening.
Still, gold produced little in the way of a pullback after breaking above $3,000 for the first time in history back in January. It recorded only a single daily close below that level before the uptrend resumed, even staging a brief retest before bulls regained control. Unless momentum turns sharply lower, gold may remain vulnerable to dip buyers — or even see an extension of its rally.

Chart analysis by Matt Simpson - Source: COMEX, LSEG

Gold Futures Positioning (GC): Weekly COT Report Analysis
Futures traders are not positioned at a sentiment extreme on gold. While both large speculators and managed funds have steadily increased their net-long exposure since May, the pace has been measured — and positioning remains well below the extremes seen at previous price peaks. Gross shorts have ticked higher but remain relatively low, while gross longs have not reached levels that typically signal overcrowding.
Overall, market positioning remains supportive of gold prices, suggesting that any pullbacks could be shallow and continue to attract dip buyers.

Chart analysis by Matt Simpson – Source: COMEX, LSEG
Gold Futures (GC) Technical Analysis: 1-Hour Chart
Prices are a touch above $4k at the time of writing as it retraces some of Thursday’s selloff during thin Asian trade today. But I am inclined to suspect the near term top is in place and that bears could fade into moves towards Thursday’s high/ Note that the monthly R1 pivot is just above $4k which could help cap gains or help form a swing high in the area.
Should bears get their way, gold could retrace to the 10-day EMA (3930) or weekly VPOC at 3892. Should bearish momentum increase then a move to 3800 could be on the cards, just above the prior weekly VPOC and monthly pivot point. But as outlined above, I suspect the retracement could be limited, so these lower targets are not currently favoured unless we see a material change in sentiment against gold.
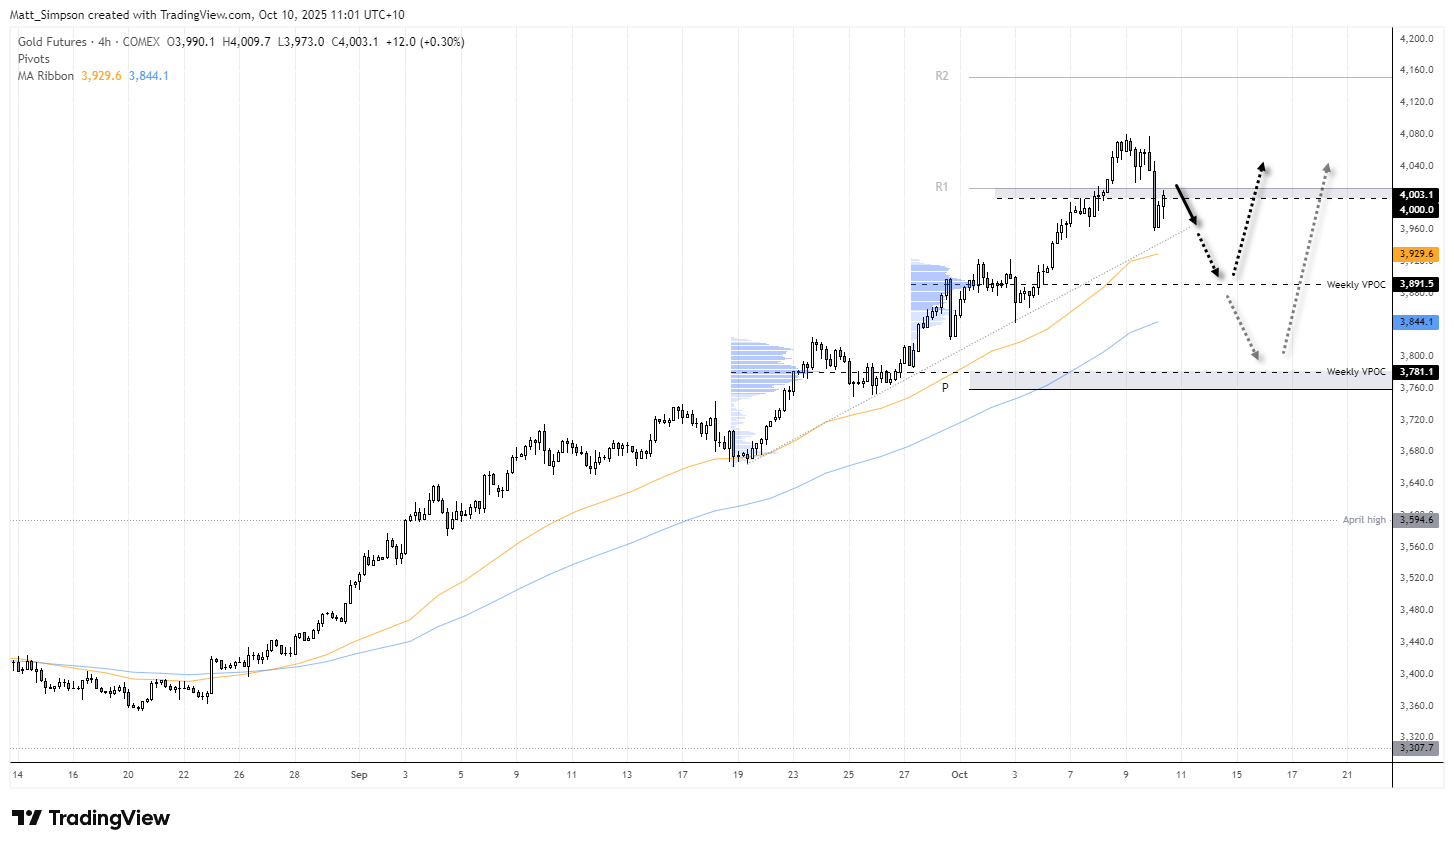
Chart analysis by Matt Simpson – Source: COMEX, LSEG
View the full economic calendar
-- Written by Matt Simpson
Follow Matt on Twitter @cLeverEdge
How to trade with City Index
You can trade with City Index by following these four easy steps:
- Open an account, or log in if you’re already a customer
• Open an account in the UK
• Open an account in Australia
• Open an account in Singapore
- Search for the market you want to trade in our award-winning platform
- Choose your position and size, and your stop and limit levels
- Place the trade


