


Japanese Yen Technical Forecast: USD/JPY Weekly Trade Levels
- USD/JPY plunges more than 2% off the highs, now testing former resistance as support at major technical confluence
- A reaction off this threshold will be critical, as a break below the median-line risks opening the door to a deeper pullback within the multi-month uptrend.
- Resistance 156.52 (key), 157.70, 158.88- Support 154.82-155.03 (key), 153.65, 151.92/94
USD/JPY is poised to mark a second consecutive weekly decline with a 2% drop off the November highs now testing confluent support. This threshold also aligns with the median of the April pitchfork, underscoring the importance of this level in both price and time. A reaction off this zone will determine whether the recent pullback stabilizes or if a deeper correction is set to unfold within the broader multi-month uptrend. The next few sessions could shape the December trajectory for the Yen pairs. Battle lines are drawn on the USD/JPY weekly technical chart.
Japanese Yen Price Chart – USD/JPY Weekly

Chart Prepared by Michael Boutros, Sr. Technical Strategist; USD/JPY on TradingView
Technical Outlook: In last month’s Japanese Yen Technical Forecast we noted that USD/JPY was trading into, “confluent resistance for a third consecutive week, and the immediate focus is on a breakout of the November opening-range for guidance. From a trading standpoint, losses should be limited to 151.92 IF price is heading for a topside break on this stretch with a close above 155 needed to fuel the next major leg higher.” USD/JPY broke higher the following week with the rally extending more than 3.3% off the November low before exhausting.
The subsequent decline is now more than 2% off the high with price testing former resistance as support this week around 78.6% retracement of the yearly range / November 2024 high close at 154.81-155.03. Note that the median of the April pitchfork converges on this threshold this week and further highlights the significance of this level in time. Looking for possible inflection off this mark early in the month.
Weekly resistance remains with the 100% extension of the April rally at 156.52, and a breach / close above this threshold is needed to mark resumption of the broader uptrend. Subsequent resistance objectives are eyed at the 2025 high-week close (HWC) at 157.70 and the yearly highs at 158.88. Strength surpassing this level would expose the next major technical consideration at the 2024 HWC / high at 160.74-161.95.
A break below the median-line would threaten a deeper pullback within the multi-month uptrend, with subsequent support seen at the 23.6% retracement of the April rally 153.65 and the 2022 and 2023 swing highs at 151.92/94. We’ll reserve this threshold as our bullish invalidation level and a break / weekly close below would be needed to suggest a more significant high is in place, and a larger trend reversal is underway towards the 52-week moving average near ~149.58.

Bottom line: USD/JPY is testing pivotal support into the start of the month, and the immediate focus is on a possible inflection off this mark. From a trading standpoint, a good zone to reduce short-exposure / lower protective stops- rallies should be limited to 156.52 IF price is heading for a larger pullback on this stretch. Ultimately, a deeper correction may offer more favorable entries closer to support with a weekly close above the 100% extension needed to mark uptrend resumption.
Keep in mind we get the September Core Personal Consumption Expenditures (PCE) on Friday. Stay nimble into the release and watch the weekly close for guidance here. Review my latest Japanese Yen Short-term Outlook for a closer look at the near-term USD/JPY technical trade levels.
USD/JPY Key Economic Data Releases
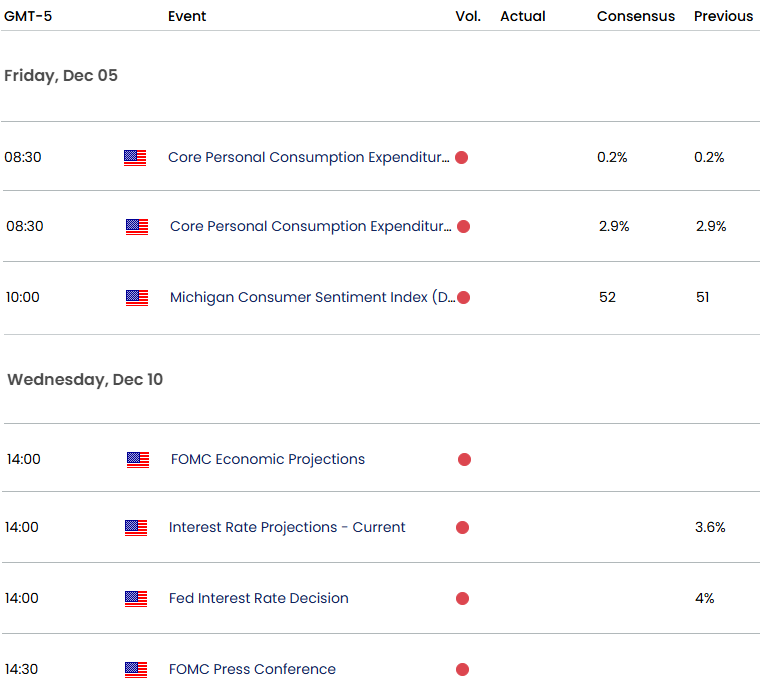
Economic Calendar - latest economic developments and upcoming event risk.
--- Written by Michael Boutros, Senior Technical Strategist
Follow Michael on X @MBForex


