


Japanese inflation surprised slightly to the upside in July, adding to speculation that the Bank of Japan (BOJ) could raise rates as early as October. Despite recent weakness in the Japanese yen, market positioning and macro momentum may shift as Fed policy expectations turn dovish and BOJ tightening nears. USD/JPY remains elevated near key resistance, but the longer-term view could favour yen strength into Q4.
View related analysis:
- Gold, Silver, Crude Oil Outlook: Technical Analysis, Market Positioning
- US Dollar Mixed Amid Anti-Fed Headlines, Flash PMIs, Jackson Hole
- GBP/USD Outlook: BOE Rate Cut Odds Fade as UK Inflation Stays Hot
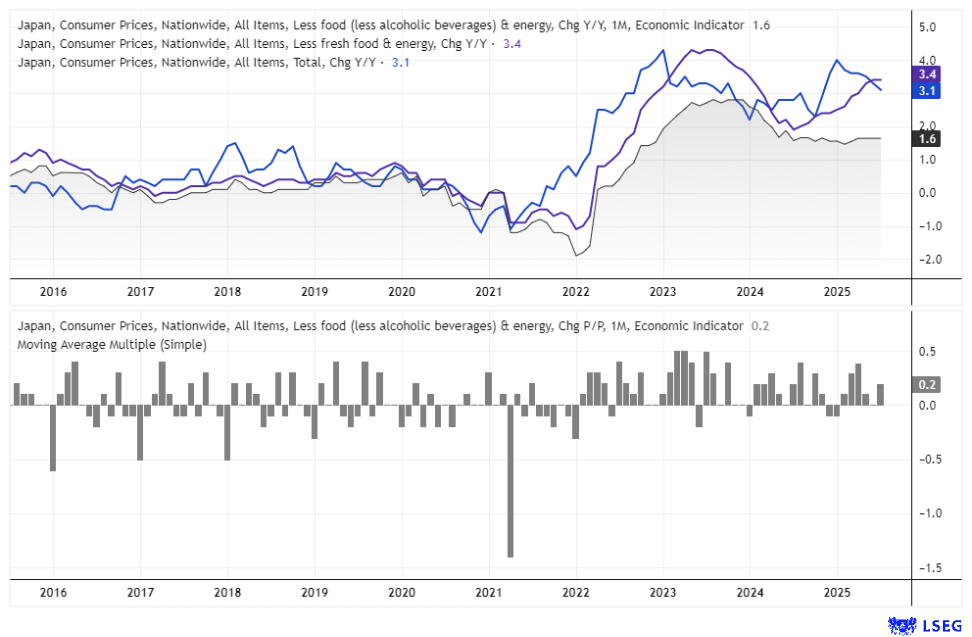
Chart prepared by Matt Simpson – data source: Statistics Bureau of Japan, LSEG
BOJ Hike Bets Grow as USD/JPY Climbs into Resistance
Japan’s inflation data came in slightly above market expectations, though it is unlikely to prompt the Bank of Japan (BOJ) to hike rates immediately. Nationwide CPI rose 3.1% y/y, just above the 3.0% forecast but slower than June’s 3.3% rise. Core-core CPI—which excludes fresh food and energy—was steady at 1.6% y/y for a fourth straight month, though it did rise 0.2% m/m in July.
Combined with stronger GDP growth and renewed trade deals with the US, a Reuters survey shows economists increasingly backing a 25bp BOJ rate hike in Q4, with October emerging as the most likely month for policy tightening.
Japanese Yen Futures (JYc1): COT Positioning Analysis
The Japanese yen has been steadily weakening against the US dollar since early April (bullish USD/JPY), and this trend has been mirrored in Commitment of Traders (COT) data. Large speculators and asset managers have been reducing net-long exposure to yen futures, driven by rising gross shorts and a pullback in gross longs.
This positioning shift has coincided with reduced expectations of near-term BOJ tightening. However, as we move closer to Q4, yen bulls may start to resurface. Indeed, last week saw a modest increase in gross-longs among large speculators, and net-long positions remain intact overall.
Looking ahead, I expect the tide to turn against the US dollar and in favour of the Japanese yen into year-end. That would send USD/JPY lower, particularly as the Fed pivots dovish and the BOJ potentially delivers a 25bp hike. That said, yen bears may retain control in the near term, with momentum currently favouring higher USD/JPY.
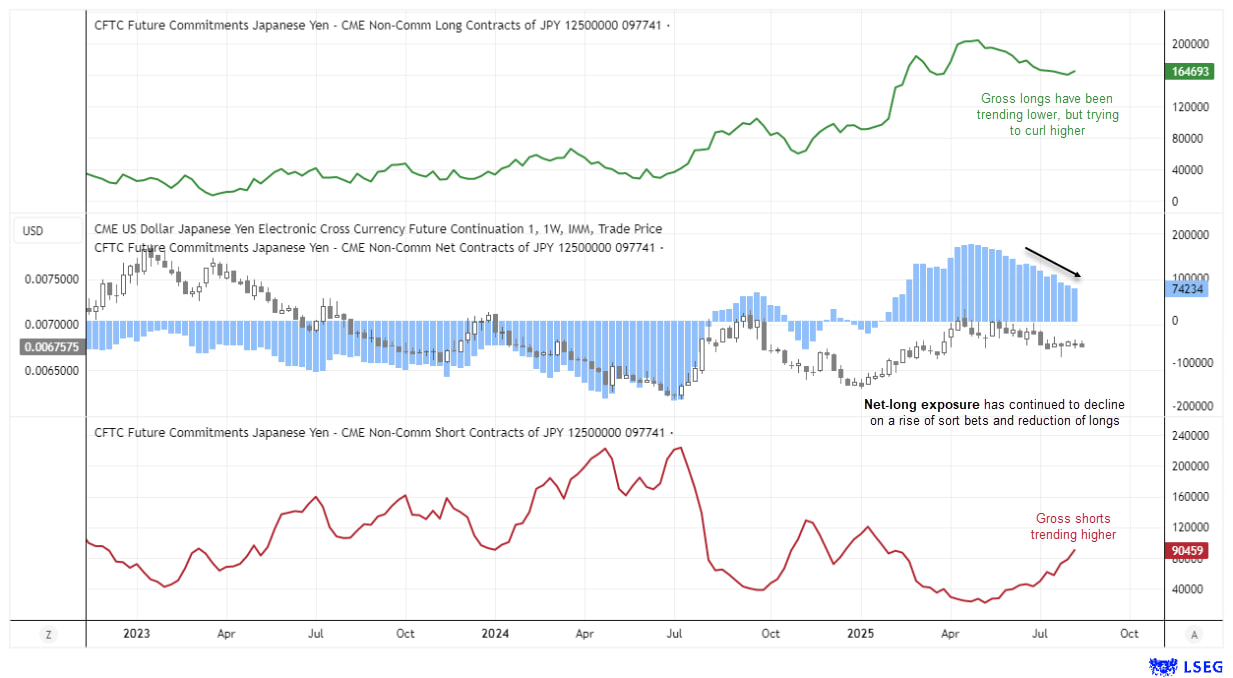
Chart prepared by Matt Simpson – data source: CME, LSEG
Japanese Yen Outlook
USD/JPY appears to offer the most appealing setup for yen bears over the near term. The US dollar remains the favoured currency, particularly if Jerome Powell strikes a hawkish tone at his Jackson Hole speech later today - contrary to market hopes for a dovish shift.
GBP/JPY also has near-term bullish potential, though the 200 handle may pose stiff resistance for those anticipating a broader upside move.
USD/JPY Technical Analysis: US Dollar vs Japanese Yen
The daily chart shows a choppy but broadly bullish trend, characterised by a series of higher lows—albeit somewhat erratic. Thursday’s bullish engulfing candle suggests an upside breakout may be imminent, bringing the 150.00 handle into focus. A break above this level could see bulls targeting the August high at 150.92 and the March high at 151.30.
That said, bulls may want to exercise caution if price approaches these levels, given the bearish signals on the weekly chart.
The rally from the September and December lows appears corrective in nature, following the sharp drop from the January high. Furthermore, an elongated shooting star formed three weeks ago, with its high falling just short of the March peak. As a result, I’m also watching closely for a potential swing high below 151, despite holding a bullish near-term bias on the daily timeframe.
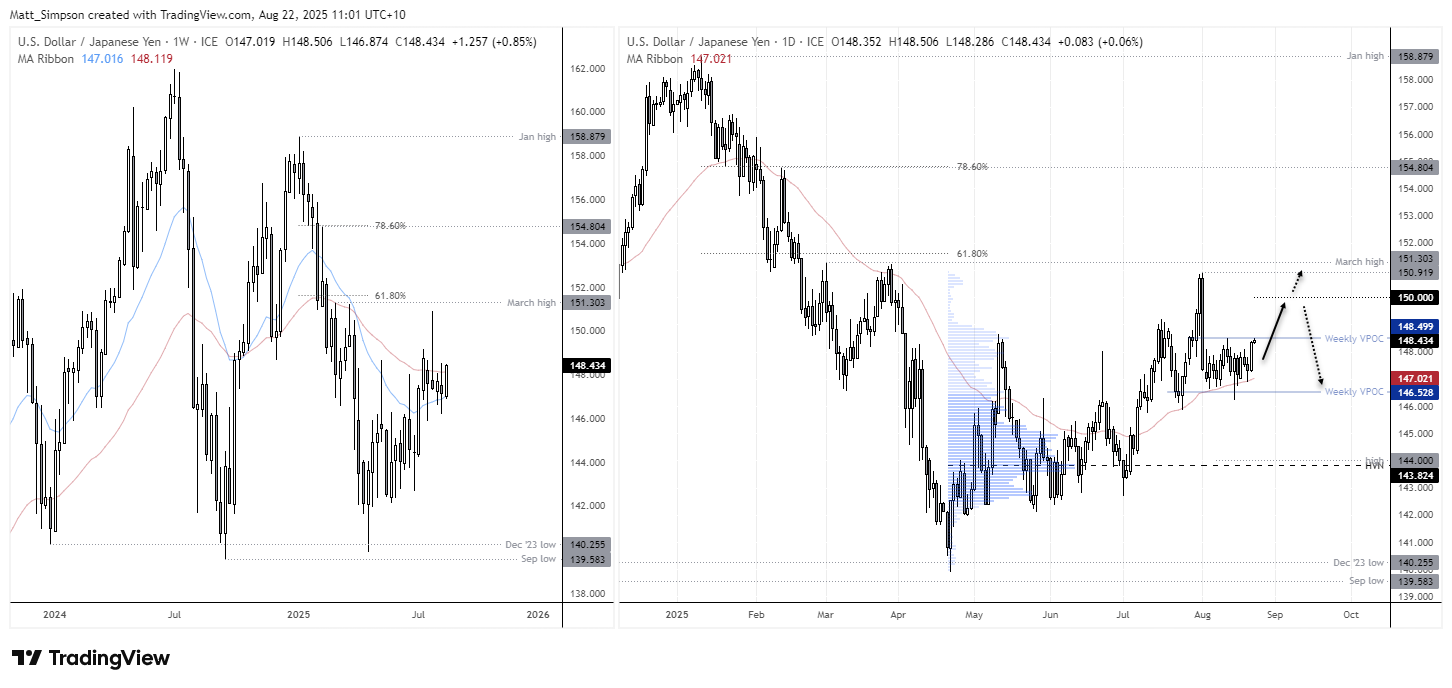
Chart analysis by Matt Simpson - Source: TradingView, ICE: USD/JPY
View the full economic calendar
-- Written by Matt Simpson
Follow Matt on Twitter @cLeverEdge
How to trade with City Index
You can trade with City Index by following these four easy steps:
- Open an account, or log in if you’re already a customer
• Open an account in the UK
• Open an account in Australia
• Open an account in Singapore
- Search for the market you want to trade in our award-winning platform
- Choose your position and size, and your stop and limit levels
- Place the trade


