


The Japanese yen remains under close watch as several major pairs pause after recent volatility. While AUD/JPY and GBP/JPY show near-term signs of stabilisation, USD/JPY appears comparatively weaker, threatening a deeper correction. Technical setups across all three pairs suggest short-term bounces may precede another leg lower if resistance levels hold – though USD/JPY shows the potential to break lower first.
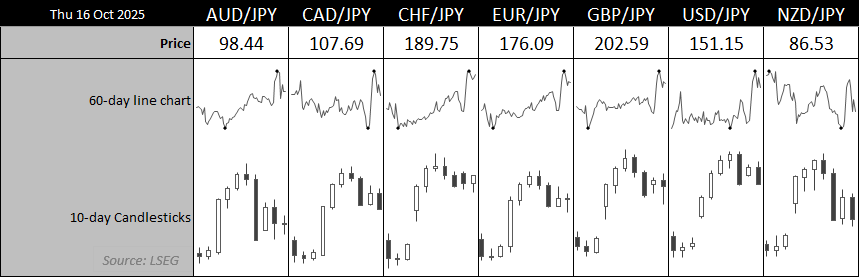
Chart analysis by Matt Simpson - data source: LSEG
View related analysis:
- US Dollar, Yields Lower After Powell Comments, GBP/USD Holds Ground
- British Pound Price Action Setups: GBP/USD, GBP/JPY
- AUD/USD, USD/JPY: Mild Rebound for Australian Dollar and Yen Faces Resistance
- ASX 200 Morning Market Outlook: Fortescue Breakout, Materials Rally
Yen Pairs Stabilise as AUD/JPY and GBP/JPY Show Rebound Potential
AUD/JPY Technical Analysis: Australian Dollar vs Japanese Yen
The Australian dollar retraced 3.1% against the Japanese yen over a two-day period from its high just below the 101 handle. The fact that AUD/JPY has since held above the 97.85 low could be seen as a sign of near-term strength. Also note the small spinning top doji near the lower bounds of the range, which closed just above the 20-day EMA — suggesting that demand may be gradually returning.
The 1-hour chart shows AUD/JPY has printed its third higher low over the past three sessions, the latest forming as a bullish hammer. The 1-hour RSI(14) has also formed a positive divergence, printing a new cycle high ahead of price action.
The bias is for at least a minor leg higher before AUD/JPY breaks below the 97.85 low. Bears may target the 97 handle near the October low, with a break beneath it bringing the 96.32 low into focus.
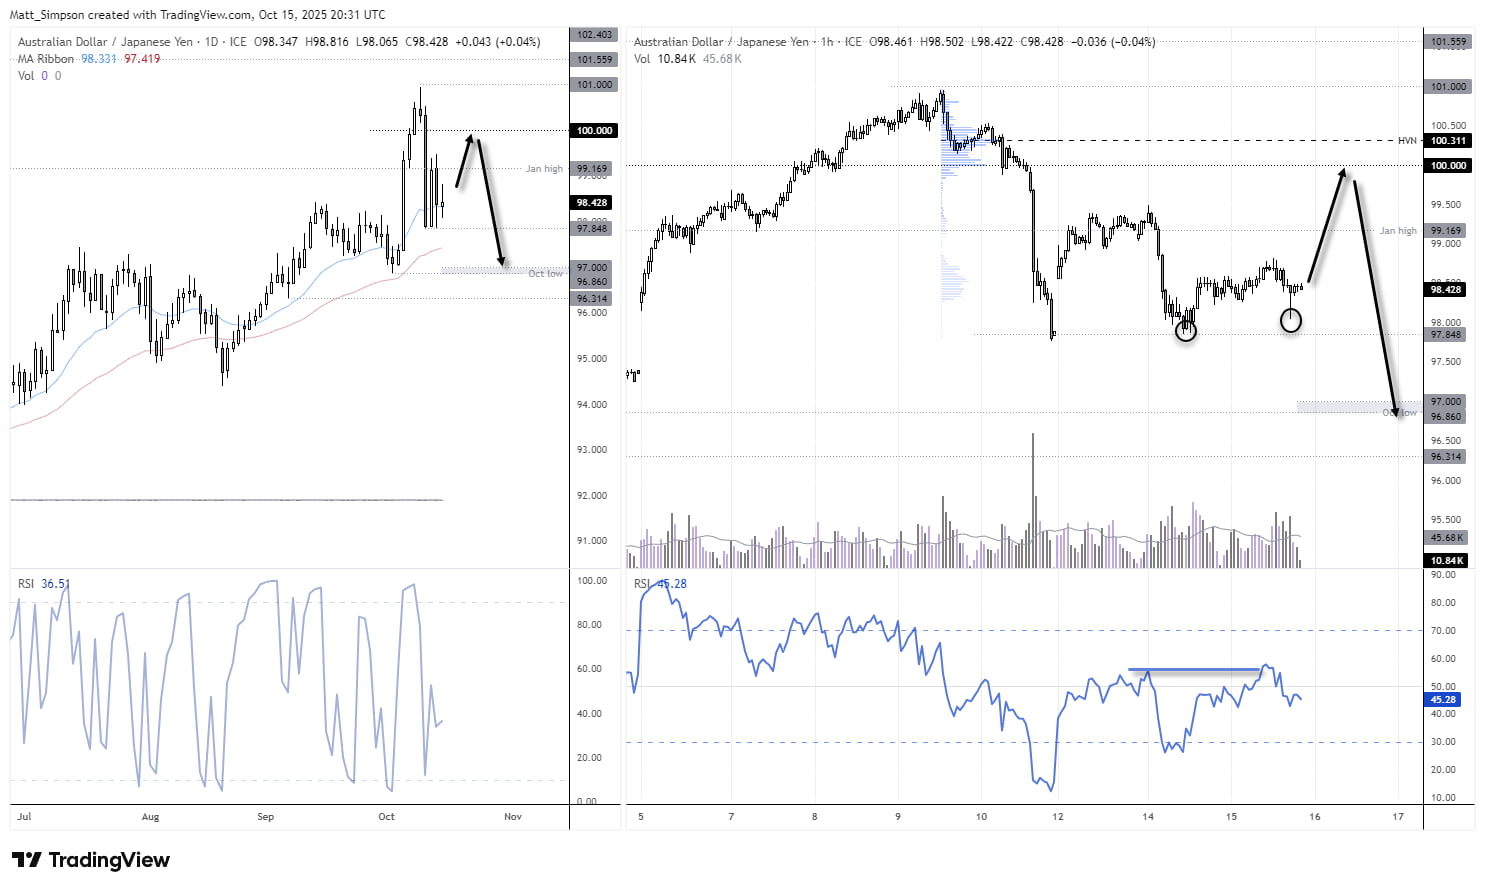
Chart analysis by Matt Simpson - data source: TradingView AUD/JPY

GBP/JPY Technical Analysis: British Pound vs Japanese Yen
The British pound is also showing signs of stability against the Japanese yen over the near-term, though like AUD/JPY, the bias is for GBP/JPY to eventually hit a new low after a bounce.
A bullish inside day formed on Wednesday, after Tuesday’s bearish engulfing (and outside) day held above the September high, 201 handle and 20-day EMA.
The 1-hour chart is effectively trending lower, but in a ‘drifting’ fashion – which leads me to suspect it is preparing for a bounce before momentum truly realigns with the bearish move from the 205 handle. Bulls could seek dips within Wednesday’s range and maintain a near-term bullish bias while GBP/JYP holds above 201. Upside targets include the resistance zone around 203.50 and the high-volume node (HVN) at 204.57 – though without a fresh catalyst, 203.50 seems more achievable.
Should a bounce materialise, I will then be on the lookout for a swing high to form and see prices revert towards the 200 handle and 50-day EMA.
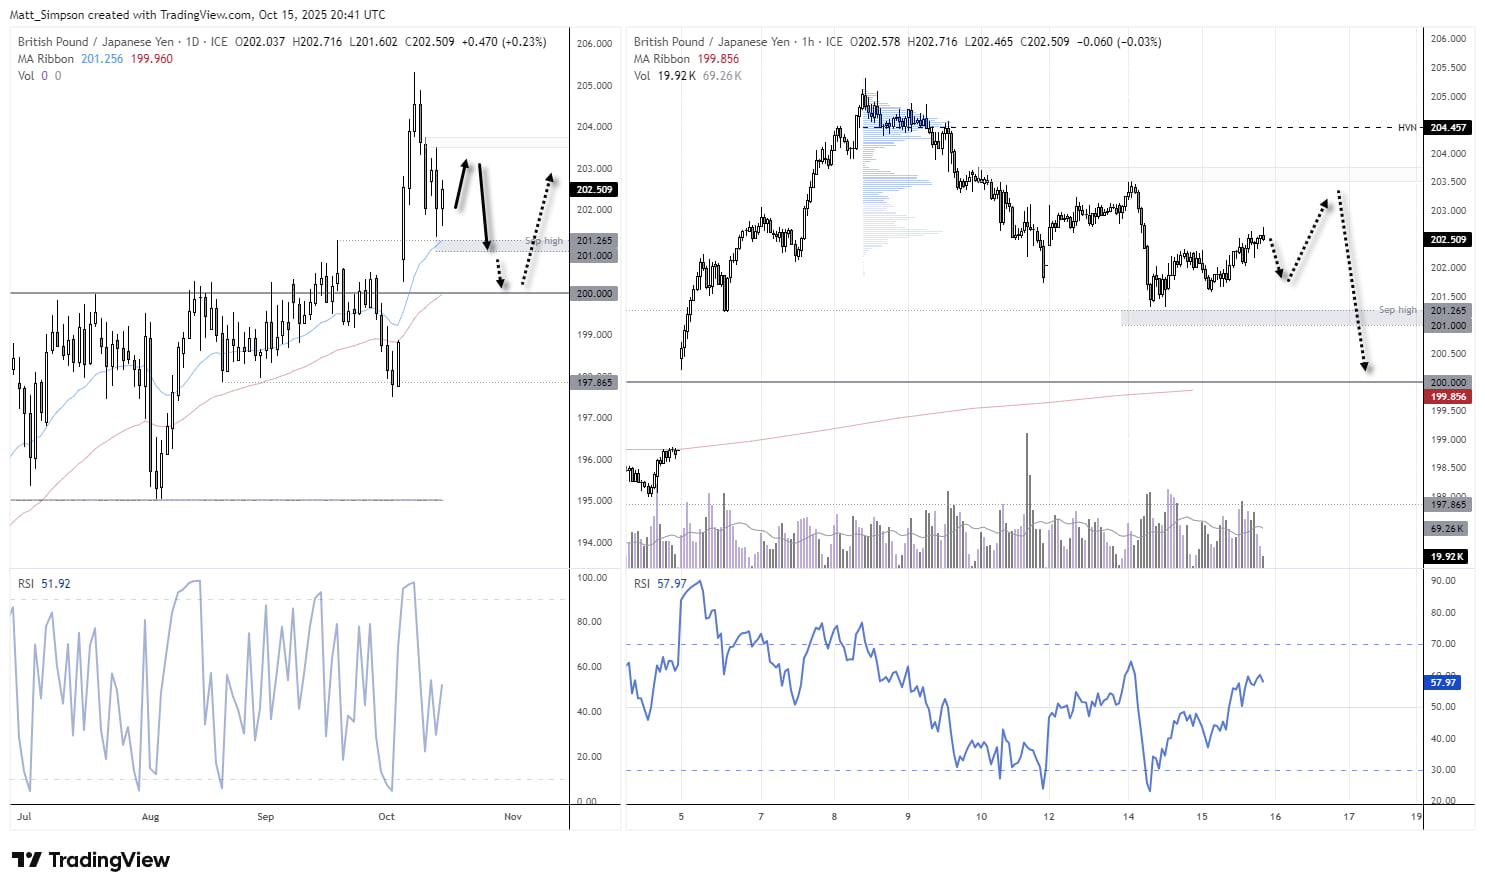
Chart analysis by Matt Simpson - data source: TradingView GBP/JPY
USD/JPY Technical Analysis: US Dollar vs Japanese Yen
Of the three yen pairs covered, price action remains somewhat more bearish on USD/JPY. The US dollar traded lower against the yen on Wednesday, with USD/JPY closing beneath the March high and now threatening a break below the August high.
On the 1-hour chart, a small inverted hammer (bearish pinbar) has formed a lower high. Bears could look to fade minor bounces on the assumption of a break beneath 150.90, with the 150 handle or the 150.33 HVN as near-term downside targets. A break below these levels would bring the 149 handle into focus, near the weekly S1 pivot (149.02).
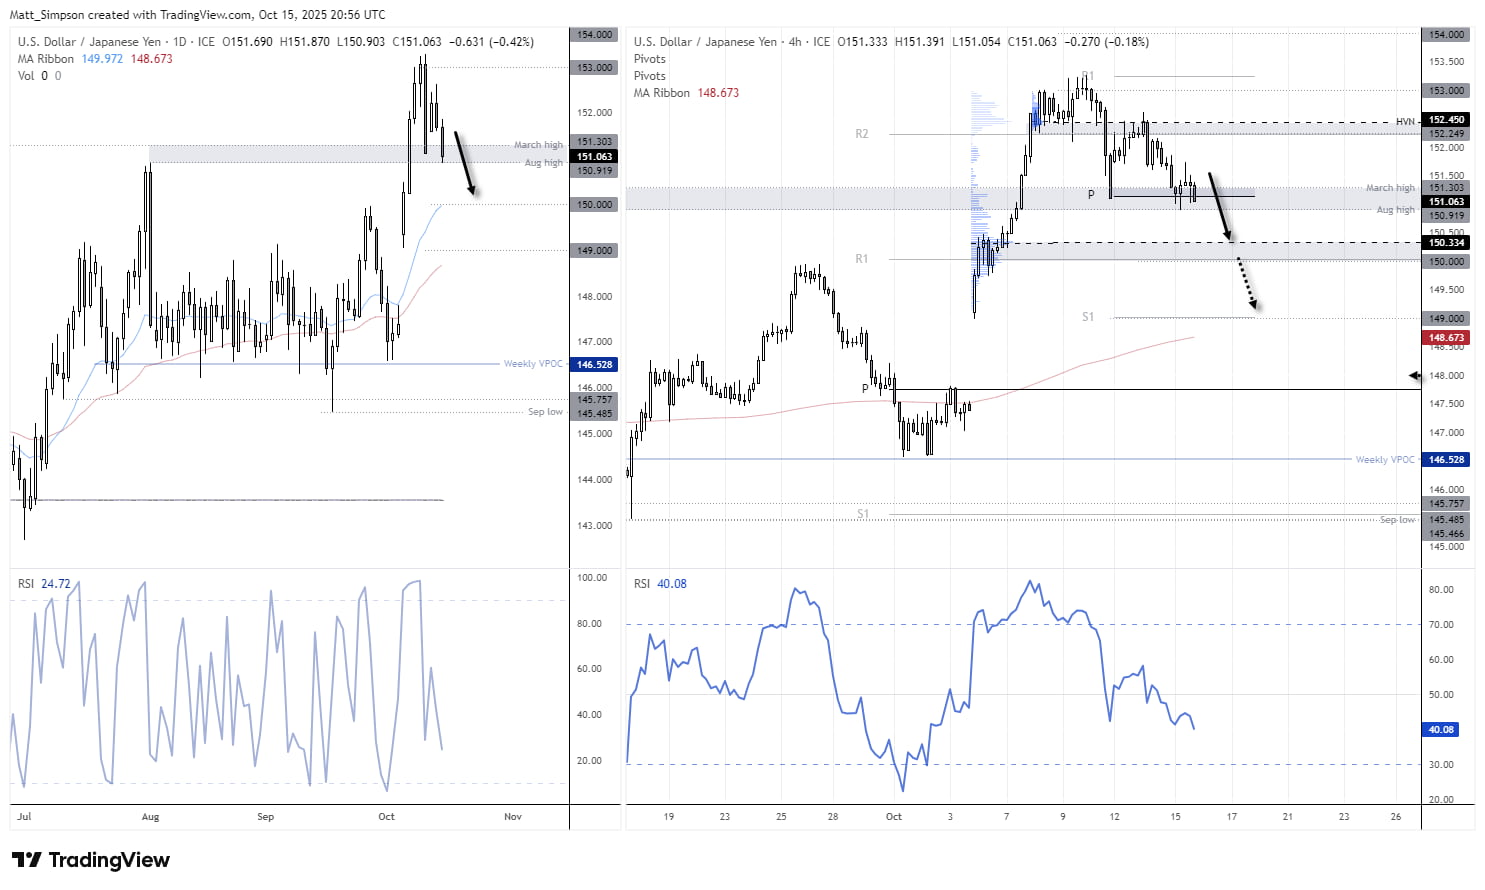
Chart analysis by Matt Simpson - data source: TradingView USD/JPY

Key Economic Events for Traders (AEDT / GMT+11)
08:45 NZD FPI (Sep) (NZD/USD, AUD/NZD, NZD/JPY)
08:50 AUD RBA Assistant Governor Kent Speaks (AUD/USD, AUD/JPY, ASX 200)
10:50 JPY Core Machinery Orders (Aug) (USD/JPY, EUR/JPY, Nikkei 225)
11:30 AUD Employment Report: Employment Change, Full-Time, Unemployment Rate, Participation Rate, Reserve Assets (Sep) (AUD/USD, AUD/JPY, ASX 200)
12:30 JPY BoJ Tamura Speaks (USD/JPY, EUR/JPY, Nikkei 225)
13:00 NZD RBNZ Offshore Holdings (Sep) (NZD/USD, AUD/NZD, NZD/JPY)
15:30 JPY Tertiary Industry Activity Index (Aug) (USD/JPY, EUR/JPY, Nikkei 225)
17:00 GBP GDP, Industrial Production, Manufacturing Production, Trade Balance, Index of Services, Construction Output (Aug) (GBP/USD, EUR/GBP, FTSE 100)
17:00 NOK Industrial Confidence (Q3) (USD/NOK, EUR/NOK, Brent Crude)
18:00 CHF SECO Economic Forecasts (USD/CHF, EUR/CHF, SMI Index)
19:30 GBP BoE Credit Conditions Survey (GBP/USD, EUR/GBP, FTSE 100)
20:00 EUR Trade Balance (Aug) (EUR/USD, EUR/GBP, DAX)
21:00 USD IMF Meetings (S&P 500, Nasdaq 100, USD/JPY)
21:00 EUR German Buba Monthly Report (EUR/USD, EUR/GBP, DAX)
22:00 GBP NIESR Monthly GDP Tracker (GBP/USD, EUR/GBP, FTSE 100)
23:00 USD FOMC Member Barkin Speaks (S&P 500, Nasdaq 100, USD/JPY)
23:15 CAD Housing Starts (Sep) (USD/CAD, EUR/CAD, CAD/JPY)
23:30 USD Philadelphia Fed Manufacturing Report (Oct) (S&P 500, Nasdaq 100, USD/JPY)
23:30 CAD New Motor Vehicle Sales (Aug) (USD/CAD, EUR/CAD, CAD/JPY)
00:00 GBP BoE MPC Member Mann Speaks (GBP/USD, EUR/GBP, FTSE 100)
00:00 USD Fed Vice Chair for Supervision Barr and Fed Waller Speak (S&P 500, Nasdaq 100, USD/JPY)
01:00 USD Business Inventories, NAHB Housing Market Index, Retail Inventories ex Auto (Aug/Oct) (S&P 500, Nasdaq 100, USD/JPY)
01:00 USD FOMC Member Bowman Speaks (S&P 500, Nasdaq 100, USD/JPY)
01:30 USD Natural Gas Storage (WTI Crude, Brent Crude, USD/CAD)
01:45 GBP BoE Deputy Governor Woods and MPC Member Mann Speak (GBP/USD, EUR/GBP, FTSE 100)
View the full economic calendar
-- Written by Matt Simpson
Follow Matt on Twitter @cLeverEdge
How to trade with City Index
You can trade with City Index by following these four easy steps:
- Open an account, or log in if you’re already a customer
• Open an account in the UK
• Open an account in Australia
• Open an account in Singapore
- Search for the market you want to trade in our award-winning platform
- Choose your position and size, and your stop and limit levels
- Place the trade


