


Japanese yen pairs are approaching key inflection points, with USD/JPY capped below 160, GBP/JPY testing resistance near 213, and AUD/JPY rolling over towards support. While the broader bias still leans bullish for yen crosses, near-term price action suggests traders may first need to navigate a period of consolidation or pullback before the next directional move unfolds.
View related analysis:
- US Dollar Outlook: Bulls Resurface, Breakout on the Cards?
- Australian Dollar Price Action Setups: AUD/USD, AUD/JPY, GBP/AUD
- FX Futures Positioning: USD, EUR, CHF, AUD, CAD | COT report
- Australian Dollar Outlook: Strait of Hormuz Risk Clouds AUD/USD Rally
Key Japanese Yen Levels: USD/JPY, GBP/JPY and AUD/JPY
USD/JPY Technical Analysis: US Dollar vs Japanese Yen
I have outlined my bullish case for the US dollar in recent articles, though the exception to that outlook – at least over the near term – is USD/JPY. Not because I think the Ministry of Finance (MOF) will intervene, but because traders don’t quite have the appetite to test them jet.
160 is the imaginary line in the sand markets have implemented, and that is seeing USD/JPY retrace from it teach time it half-heartedly approaches it. And with month and quarter-end flows, price action could now become fickle and prompt a messy pullback anyway.
Despite my bias for a near-term pullback, we still might see the US dollar break above 160 against the Japanese yen in the coming weeks, while USD/JPY remains above the 157.50 low.
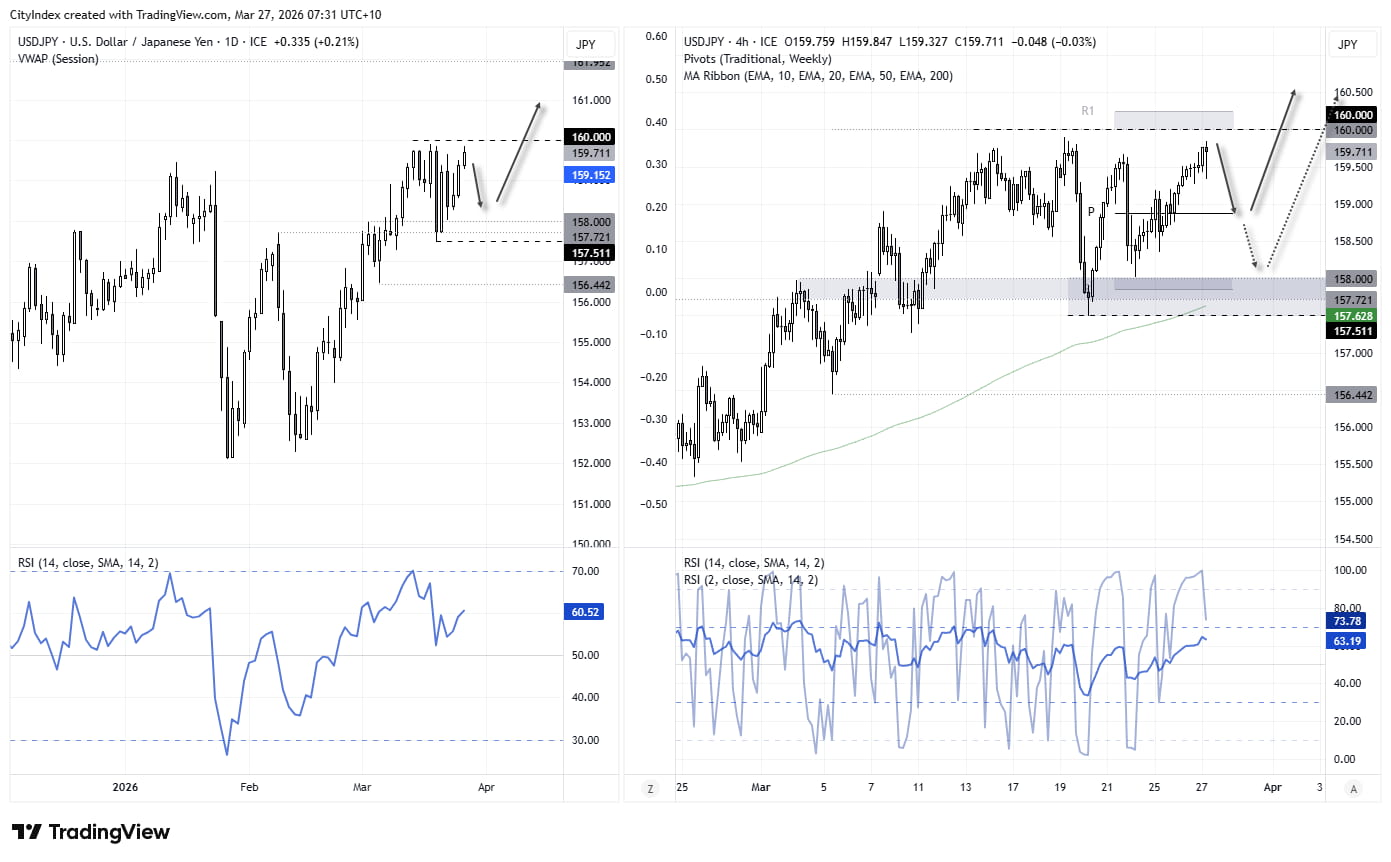
Source: ICE, TradingView
GBP/JPY Technical Analysis: British Pound vs Japanese Yen
A similar scenario is unfolding for GBP/JPY, where the broader bias still favours a bullish breakout—but the risk of a near-term pullback remains. The 213 level stands as a clear line in the sand for both bulls and bears.
Bulls could either wait for a retracement and signs of a swing low to enter at more favourable levels, or simply wait for a confirmed breakout above resistance. Meanwhile, traders willing to fade the move could look for bearish setups while prices remain capped beneath recent swing highs.
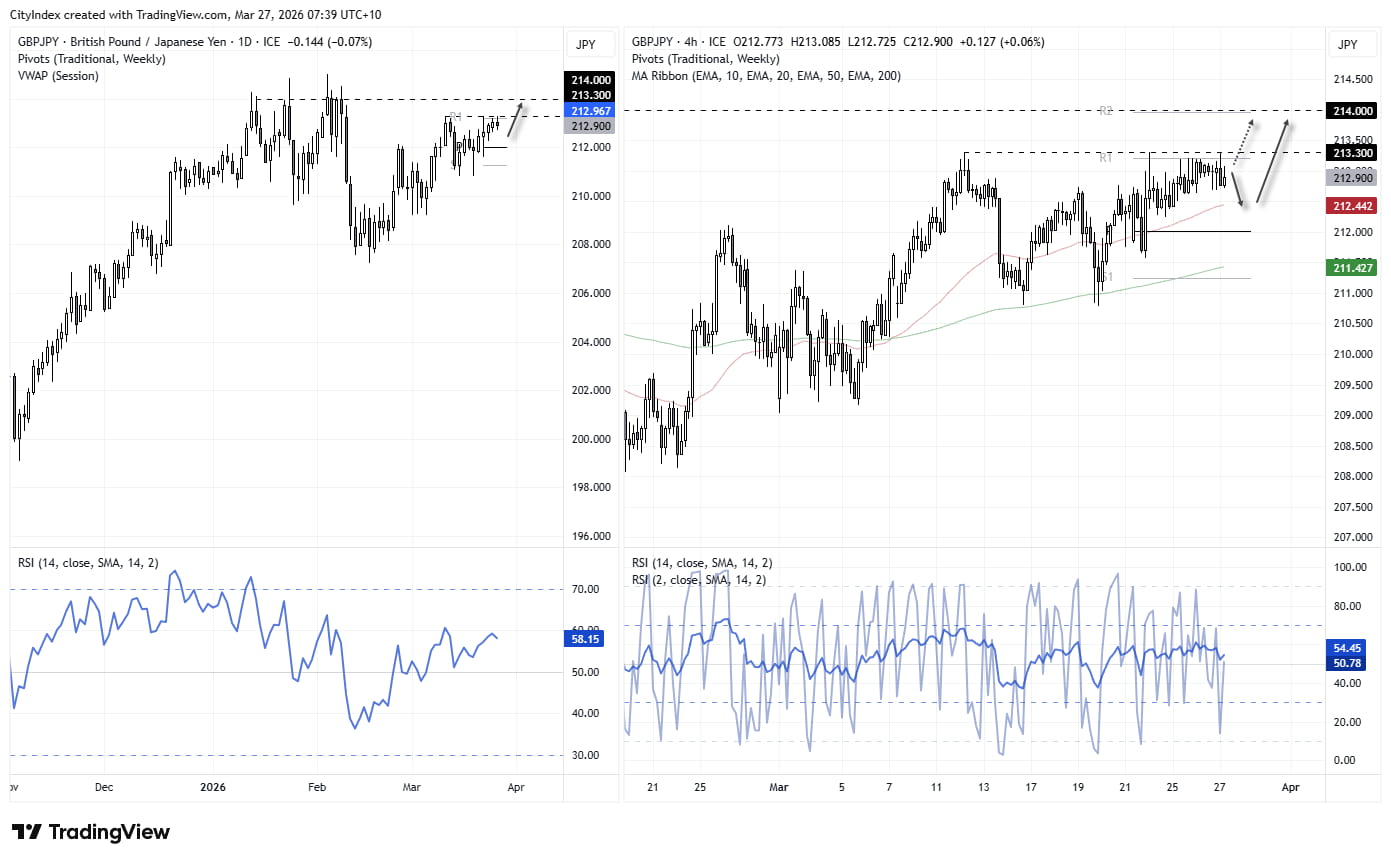
Source: ICE, TradingView
AUD/JPY Technical Analysis: Australian Dollar vs Japanese Yen
Rejection at 112 Signals Momentum Shift
The uptrend on the weekly chart for AUD/JPY has been a clear outperformer since Trump’s tariff lows back in April. The Australian dollar has rallied on risk appetite and renewed bets of RBA hikes, while the Japanese yen has lagged amid the same risk-on backdrop and growing realisation that the BOJ is unlikely to hike as aggressively as once hoped.
That has meant retracements on AUD/JPY have been minimal to non-existent—though it’s giving one a decent attempt now. Two shooting stars over the past two weeks warned of weakness around 112, with both candles failing to close above it. Momentum has since turned lower.

AUD/JPY Tests Critical Support Zone Near 110
The daily chart shows bearish momentum accelerating again on Thursday, with AUD/JPY now hurtling towards a notable cluster of support levels. Prices are teasing a break below 110 at the time of writing, though the 1991 high (109.70) is arguably the bigger level for bears to target. The 50-day EMA (109.60) and 2024 high (109.37) also sit nearby.
Ultimately, this could be a make-or-break moment for the broader AUD/JPY uptrend. In the near term, however, bears will be eyeing a test of these support levels.
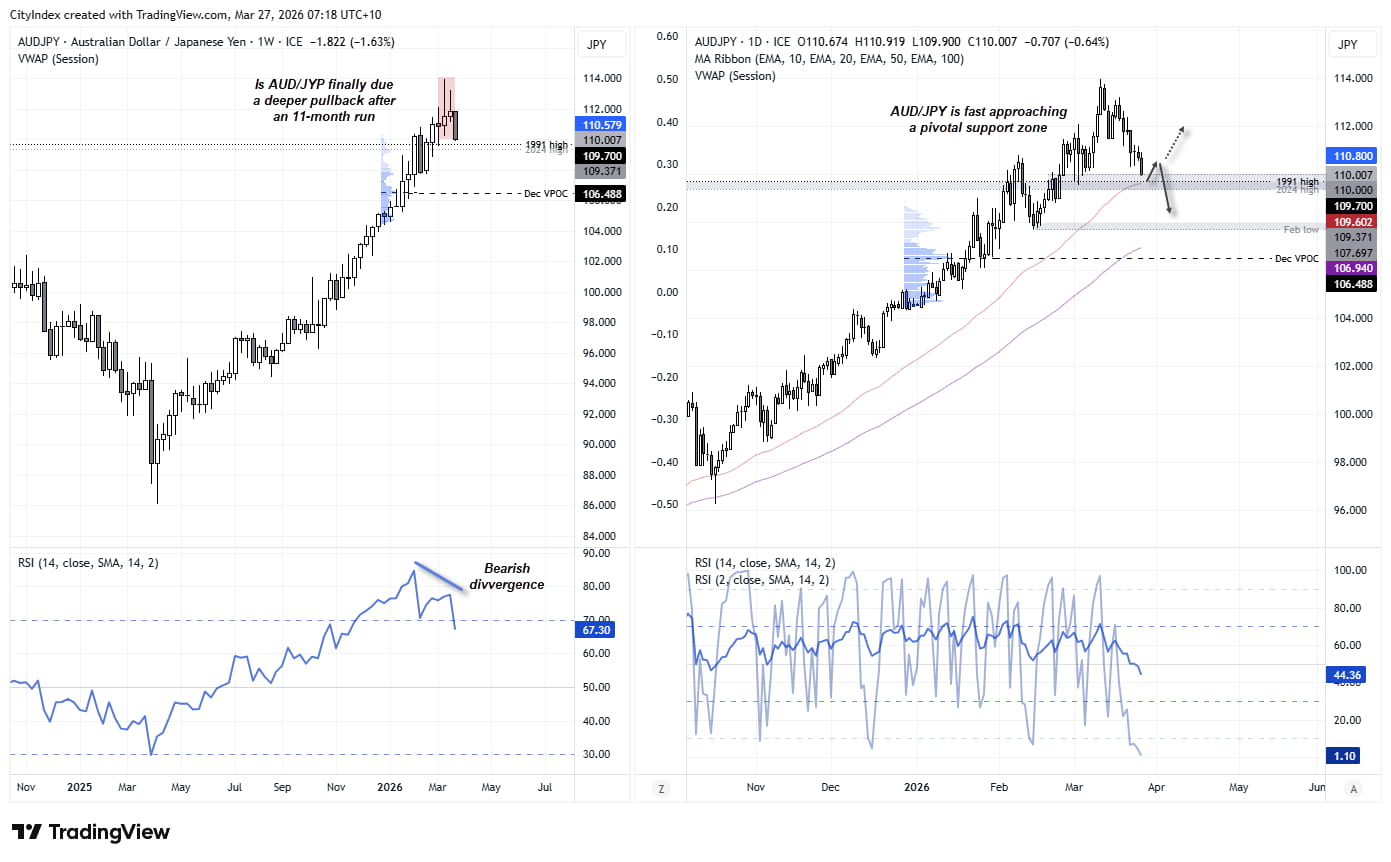
Source: ICE, TradingView
View the full economic calendar
-- Written by Matt Simpson
Follow Matt on Twitter @cLeverEdge
How to trade with City Index
You can trade with City Index by following these four easy steps:
- Open an account, or log in if you’re already a customer
• Open an account in the UK
• Open an account in Australia
• Open an account in Singapore
- Search for the market you want to trade in our award-winning platform
- Choose your position and size, and your stop and limit levels
- Place the trade


