


After weeks of relentless selling, the Japanese yen is showing the first signs of stabilisation. A series of bearish reversal patterns across yen crosses suggest the selloff may be losing steam. Meanwhile, the Australian dollar remains under pressure, with AUD/JPY testing key support near 100 and AUD/USD eyeing a retest of its 200-day EMA.
View related analysis:
- US Dollar Rebound Appears Corrective, EUR/USD And GBPUSD Set To Bounce?
- Japanese Yen Price Action Setups: USD/JPY, AUD/JPY
- New Zealand Dollar Sinks After RBNZ’s Dovish 50 bp Cut
- AUD/USD Q4 Outlook: Bears Target Slower Growth, RBA Cut
Japanese Yen Shows Early Signs of Reversal Across Major Pairs
We’re finally seeing signs of weakness across Japanese yen pairs as we head into the weekend. I had questioned whether the likely new prime minister would truly have as much influence over the Bank of Japan (BOJ) as markets feared. Already, we’re seeing some of her campaign rhetoric being walked back, with Sanae Takaichi stating she is not in favour of an excessively weak yen. Perhaps more importantly, she said there is no immediate need to revise how the government and the BOJ approach policy — which, to me, gives the BOJ a green light to hike once this year.
The Japanese yen rose against all major currencies except the US dollar. Yesterday I noted early signs of fading momentum across yen crosses, and on Thursday we saw more compelling evidence of at least a pause — if not a near-term reversal. GBP/JPY and EUR/JPY formed bearish engulfing candles, NZD/JPY posted a bearish outside day, and shooting star patterns appeared on AUD/JPY and CAD/JPY. CHF/JPY went a step further, forming a three-bar reversal known as a morning star — the third candle of which was a bearish engulfing day. This may not trigger a deep pullback against this week’s rally, but it does serve as a clear warning to bulls in the near term.

Chart analysis by Matt Simpson - data source: TradingView

AUD/JPY Technical Analysis: Australian Dollar vs Japanese Yen
The daily chart shows an explosive move higher on AUD/JPY, though the shooting star candle just below 101 warns of near-term weakness. On the 1-hour chart, a broken trendline and emerging bear flag pattern highlight potential downside risks.
The key level to watch is the 100 handle. A break beneath it would signal a deeper retracement, bringing the January high and high-volume node near 99.17 into focus. Conversely, if 100 holds as support, AUD/JPY bulls may attempt one final push through 101 before momentum fades.
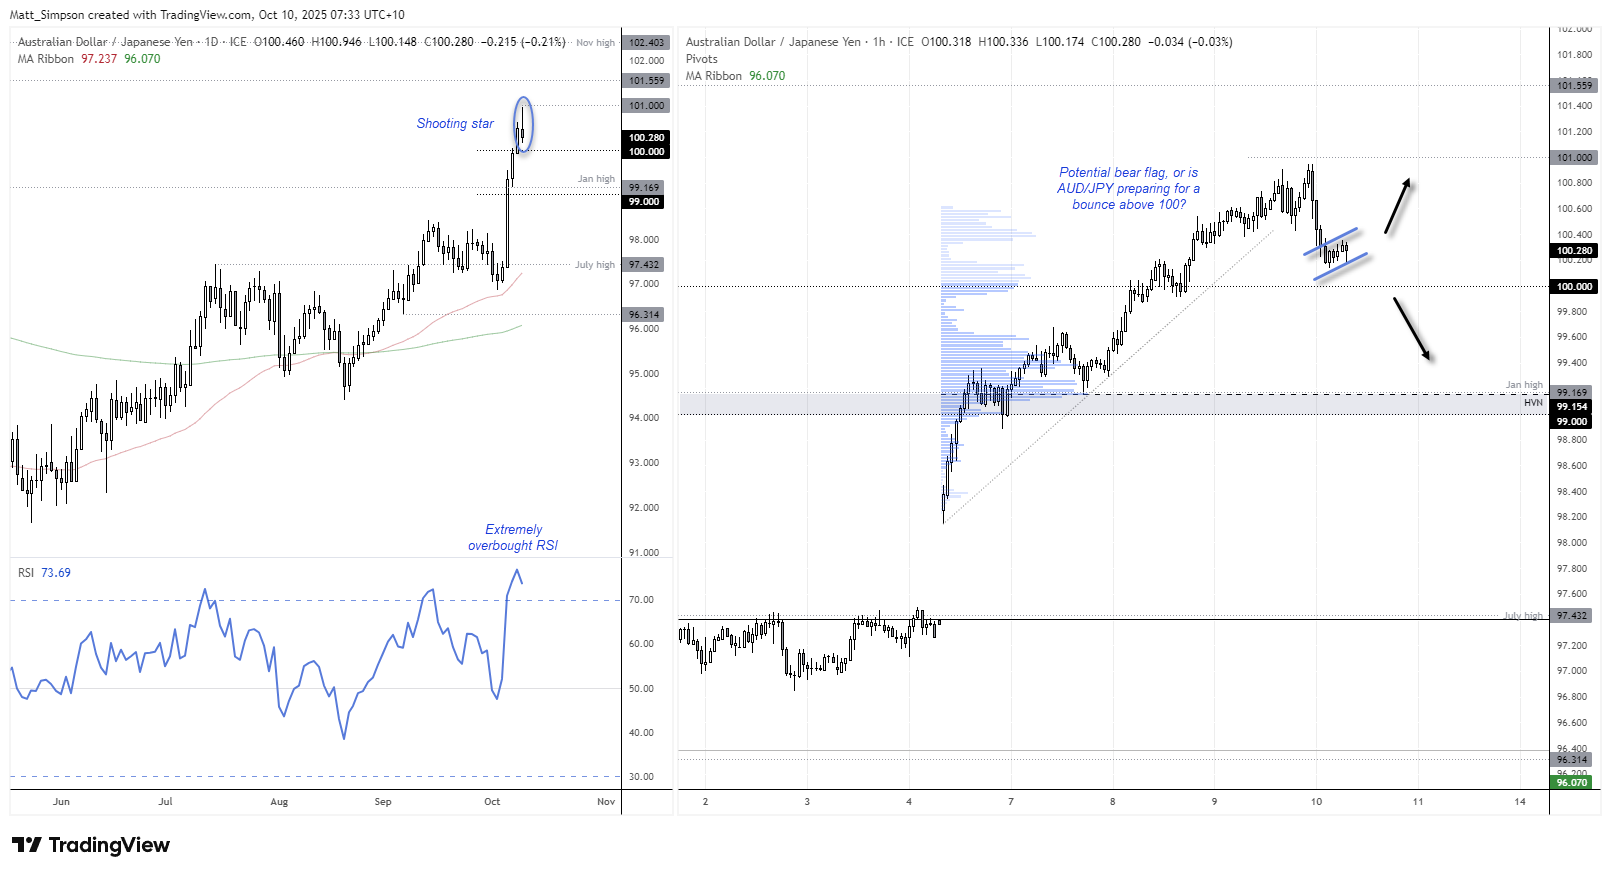
Chart analysis by Matt Simpson - data source: TradingView AUD/JPY
AUD/USD Technical Analysis: Australian Dollar Bears Eye 200-day EMA
The Australian dollar has once again failed to clear the July high, reaffirming it as a key resistance level. Tuesday’s bearish engulfing candle signalled renewed downside momentum from the 0.67 handle, bringing a move back towards 0.65 – near the 200-day EMA at 0.6492 – into focus.
Thursday’s bearish outside day has put AUD/USD bears within striking distance of the 0.6520 low. With the daily RSI (2) confirming the downside move and not yet oversold, the bias remains for a break beneath 0.6520 and a potential retest of the 200-day EMA support zone.
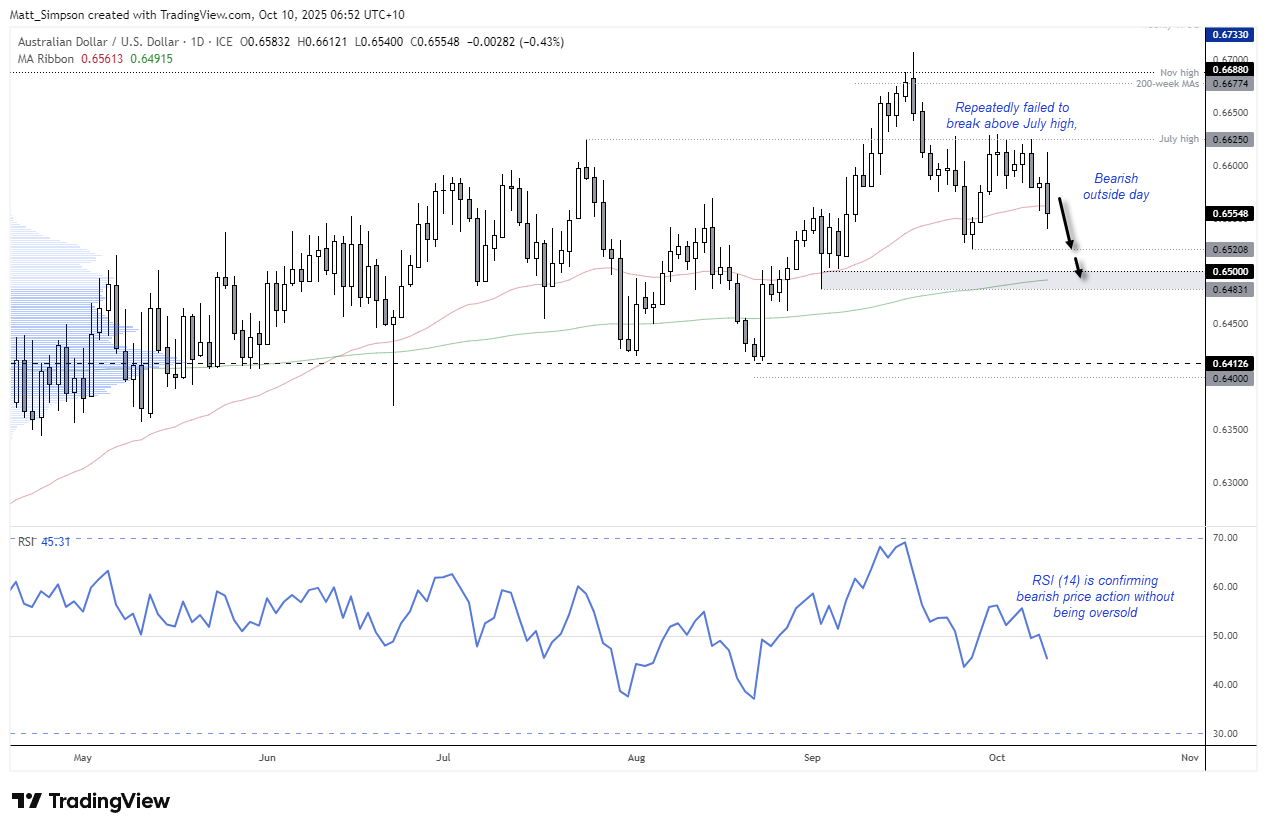
Chart analysis by Matt Simpson - data source: TradingView AUD/USD
AUD/USD Technical Analysis: 1-Hour Chart
Another surge in US dollar strength after the US open is evident on the 1-hour AUD/USD chart, with the Australian dollar sliding 1% within three hours. However, the 1-hour RSI (2) has reached oversold territory and formed a mild bullish divergence after the sharp drop, suggesting the potential for a short-term bounce.
Any recovery may simply allow Australian dollar bears to seek a lower high within Thursday’s range, improving risk-to-reward potential for a continuation lower towards the 0.65 handle.
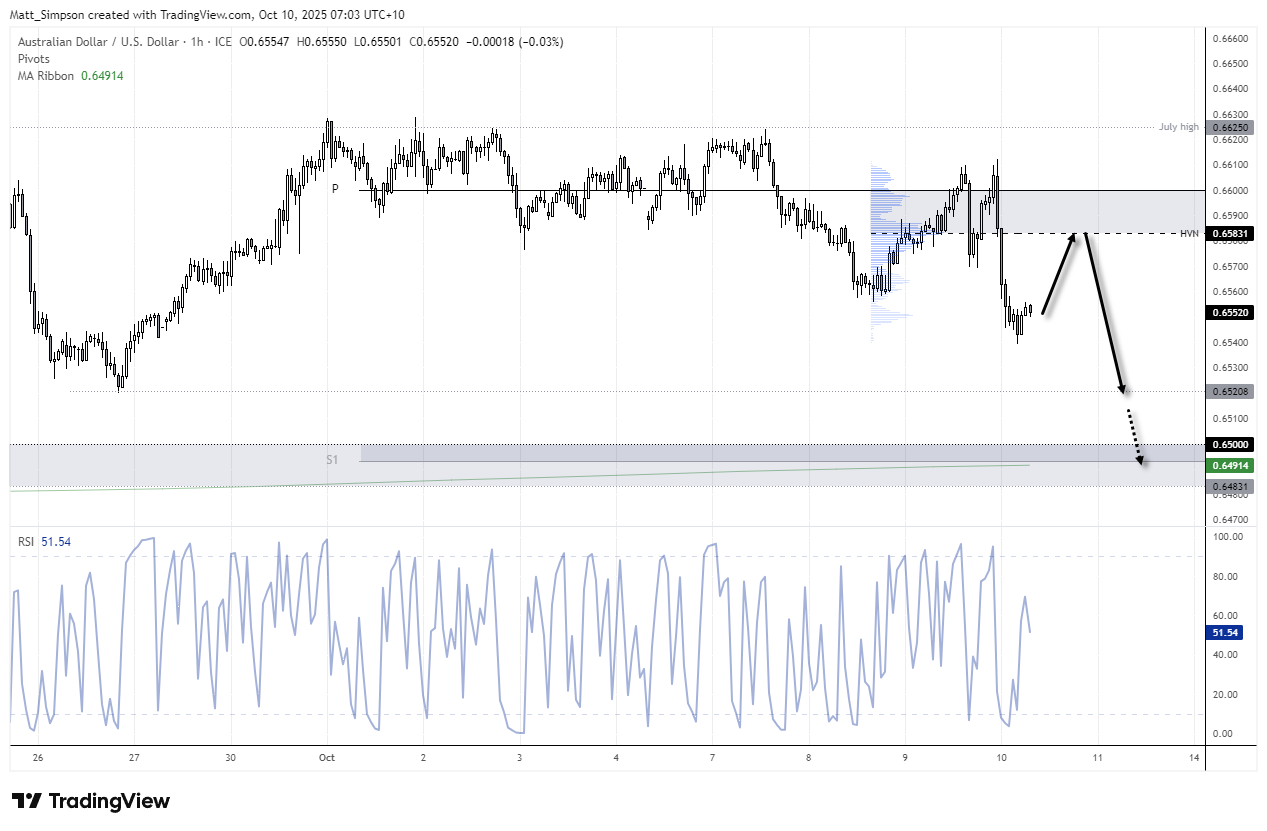
Chart analysis by Matt Simpson - data source: TradingView AUD/USD

Key Economic Events for Traders (AEDT / GMT+11)
08:30 NZD Business NZ PMI (Sep) (NZD/USD, AUD/NZD, NZD/JPY)
09:00 AUD RBA Governor Bullock Speaks, RBA Assistant Governor Kent Speaks (AUD/USD, AUD/JPY, ASX 200)
10:50 JPY Bank Lending, PPI (Sep) (USD/JPY, EUR/JPY, Nikkei 225)
12:00 AUD RBA Governor Bullock Speaks (AUD/USD, AUD/JPY, ASX 200)
12:40 USD FOMC Member Daly Speaks (S&P 500, Nasdaq 100, USD/JPY)
13:00 AUD Thomson Reuters IPSOS PCSI (Oct) (AUD/USD, AUD/JPY, ASX 200)
13:00 JPY Thomson Reuters IPSOS PCSI (Oct) (USD/JPY, EUR/JPY, Nikkei 225)
13:00 CNY China Thomson Reuters IPSOS PCSI (Oct) (USD/CNH, AUD/CNH, CN50 Index)
18:00 CHF SECO Consumer Climate (USD/CHF, EUR/CHF, SMI Index)
21:00 EUR ECOFIN Meetings (EUR/USD, EUR/GBP, DAX)
23:30 USD Nonfarm Payrolls, Unemployment Rate, Average Hourly Earnings, Private Payrolls, Government & Manufacturing Payrolls, Participation Rate, Average Weekly Hours, U6 Unemployment Rate (Sep) (USD/JPY, S&P 500, Nasdaq 100)
23:30 CAD Employment Change, Unemployment Rate, Wages, Full-Time & Part-Time Employment, Participation Rate (Sep) (USD/CAD, EUR/CAD, CAD/JPY)
00:45 USD Fed Goolsbee Speaks (S&P 500, Nasdaq 100, USD/JPY)
01:00 USD Michigan Consumer Sentiment, Current Conditions, Expectations, 1-Year & 5-Year Inflation Expectations (Oct) (S&P 500, Nasdaq 100, USD/JPY)
View the full economic calendar
-- Written by Matt Simpson
Follow Matt on Twitter @cLeverEdge
How to trade with City Index
You can trade with City Index by following these four easy steps:
- Open an account, or log in if you’re already a customer
• Open an account in the UK
• Open an account in Australia
• Open an account in Singapore
- Search for the market you want to trade in our award-winning platform
- Choose your position and size, and your stop and limit levels
- Place the trade


