


Japanese Yen Technical Forecast: USD/JPY Short-term Trade Levels
- USD/JPY plunges 1.9% off September high- now testing key support pivot
- USD/JPY monthly opening-range set just above support, breakout imminent- U.S. Core PPI / CPI on tap
- Resistance 147.42, 148.65/74, 149.12 (key)- Support 146.54/70, 145.83 (key), 144.10/43
USD/JPY is holding within a multi-week consolidation, with price pinned just above key support. This well-defined range highlights a pivotal near-term inflection point, with traders looking for a breakout to provide directional guidance in the days ahead. Battle lines drawn on the USD/JPY short-term technical charts.
Japanese Yen Price Chart – USD/JPY Daily

Chart Prepared by Michael Boutros, Sr. Technical Strategist; USD/JPY on TradingView
Technical Outlook: In last month’s Japanese Yen Short-term Outlook, we noted that USD/JPY had set a range just above support and that, “From a trading standpoint, rallies should be limited to 149.50 IF price is heading lower on this stretch with a close below 146.28 needed to fuel the next major leg of the decline.” USD/JPY surged more than 1.4% into the September open before exhausting at the 61.8% retracement of the August decline at 149.12 (high registered at 149.14). The subsequent reversal has extended 1.9% off the monthly high and takes price into confluent support today at the lower bounds of a multi-week range in price- looking for a reaction off this mark this week.
Japanese Yen Price Chart – USD/JPY 240min
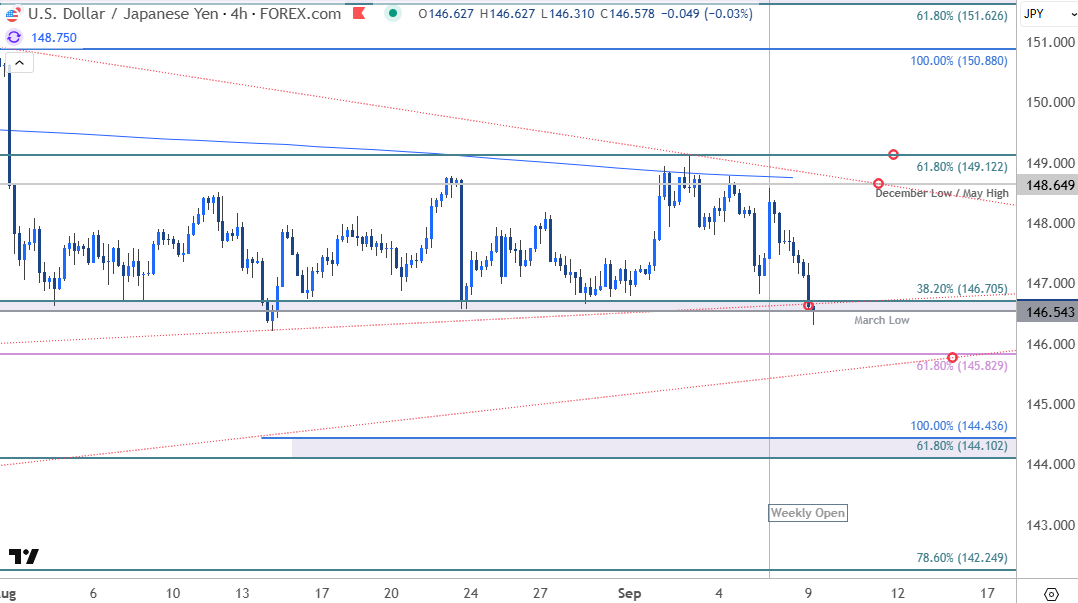
Chart Prepared by Michael Boutros, Sr. Technical Strategist; USD/JPY on TradingView
A closer look at Japanese Yen price action shows USD/JPY consolidating within the August range with price testing support in early US trade at 146.54/70- a region defined by the March swing low and the 38.2% retracement of the April advance. A break lower here would expose the 61.8% retracement of the July rally at 145.83 and the 61.8% retracement of the broader April rally / 100% extension of the August decline at 144.10/43- look for a larger reaction there IF reached. Losses below this threshold would suggest a more significant high is in place / a larger reversal is underway towards subsequent support at 142.25.
Weekly-open resistance is eyed at 147.42 and is backed by the December low / May high / 200-day moving average at ~148.65/73. Near-term bearish invalidation is now set to the 61.8% retracement of the August decline / September opening-range high at 149.12- a topside breach / close above this threshold would be needed to mark resumption of the broader uptrend.

Bottom line: USD/JPY has carved the September opening-range just above support at the lower bounds of a multi-week range- looking for a breakout in the days ahead for guidance here. From a trading standpoint, a good zone to reduce portions of short-exposure – rallies should be limited to the 200DMA IF price is heading lower on this stretch with a close below the April trendline ultimately needed to validate a break of the multi-month uptrend.
Keep in mind we get the release of key US inflation data with Core PPI & CPI data on top tomorrow and Thursday respectively. Stay nimble into the release and watch the weekly close here for guidance. Review my latest Japanese Yen Weekly Forecast for a closer look at the longer-term USD/JPY technical trade levels.
USD/JPY Key Economic Data Releases
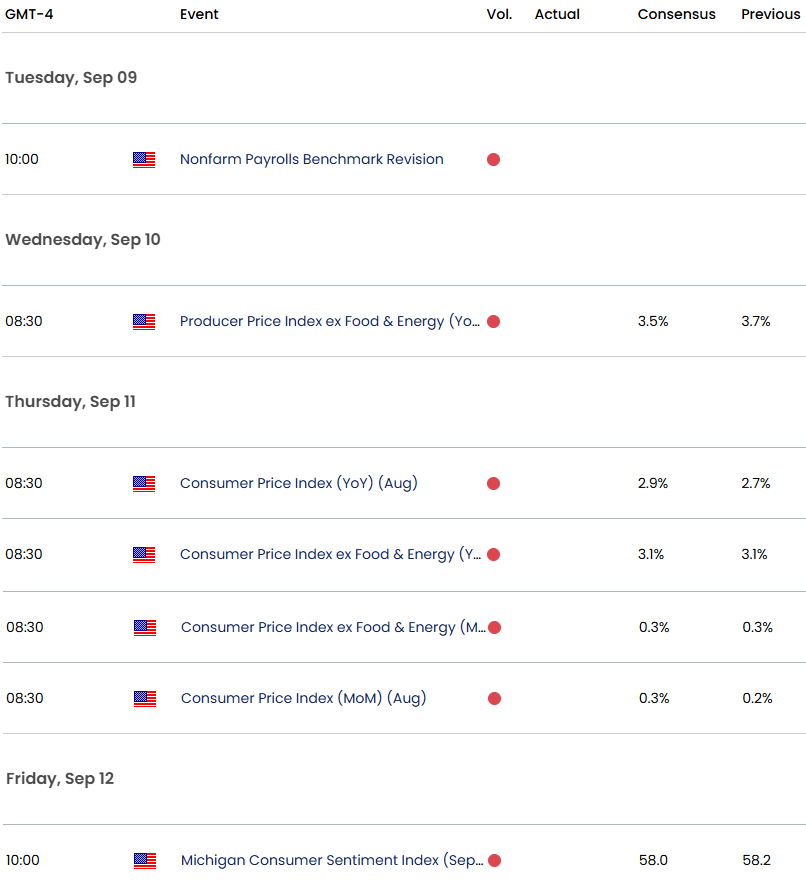
Economic Calendar - latest economic developments and upcoming event risk.
--- Written by Michael Boutros, Sr Technical Strategist
Follow Michael on X @MBForex


