


Japanese Yen Technical Forecast: USD/JPY Short-term Trade Levels
- USD/JPY trading within the confines of a multi-month uptrend with price now coiling just below key resistance.
- Weekly and monthly opening-ranges taking shape- breakout to offer guidance
- Resistance 154.82 (key), 156.27/44, 157.19- Support 153.08/27, 151.63/95 (key), 150.74
The Japanese Yen is getting a brief reprieve from recent selling pressure, with USD/JPY consolidating near the upper bounds of a multi-month uptrend. The immediate focus is on a breakout of this range at nine-month highs for guidance into November trade. A topside breach would mark resumption of the broader advance, while a break below the October slope could trigger a deeper correction in the days ahead. Battle lines are drawn on the USD/JPY short-term technical charts.
Japanese Yen Price Chart – USD/JPY Daily
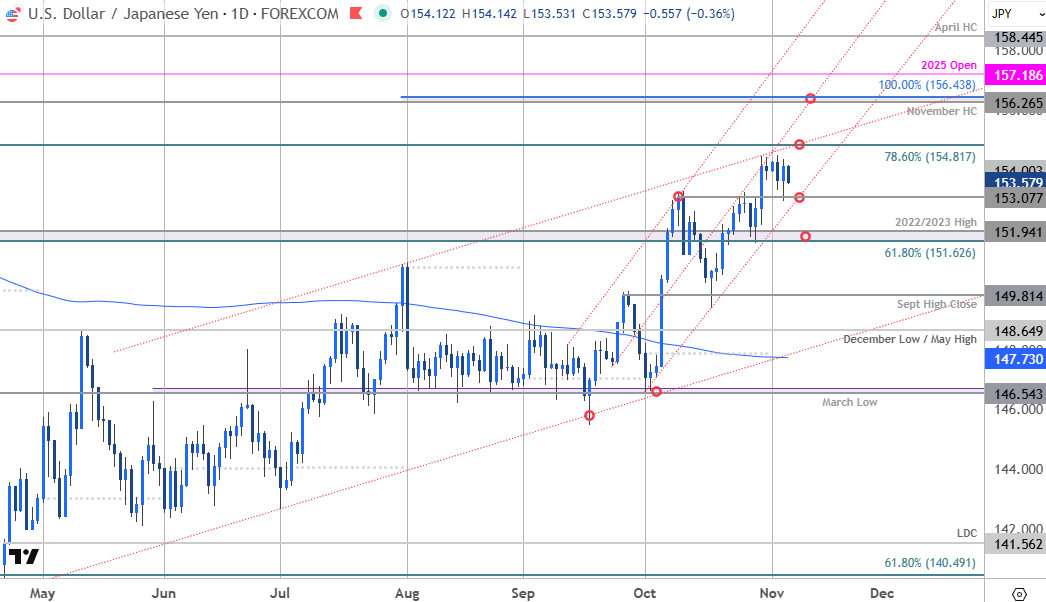
Chart Prepared by Michael Boutros, Sr. Technical Strategist; USD/JPY on TradingView
Technical Outlook: In last month’s Japanese Yen Short-term Outlook, we noted that USD/JPY was trading just below resistance at the October high ahead of the Fed rate decision and that, “losses would need to be limited to 150.88 IF price is heading higher on this stretch with a close above 153.27 needed to fuel the next leg of this advance.” USD/JPY pulled back more than 1.1% in the following days with price registering an intraday low at 151.54 before reversing sharply higher post-FOMC.
The subsequent rally extended more than 1.9% off those lows with USD/JPY exhausting at uptrend resistance into the start of November. The weekly and monthly opening-range is taking shape just below and the focus is on a breakout in the days ahead to offer guidance here.
Japanese Yen Price Chart – USD/JPY 240min
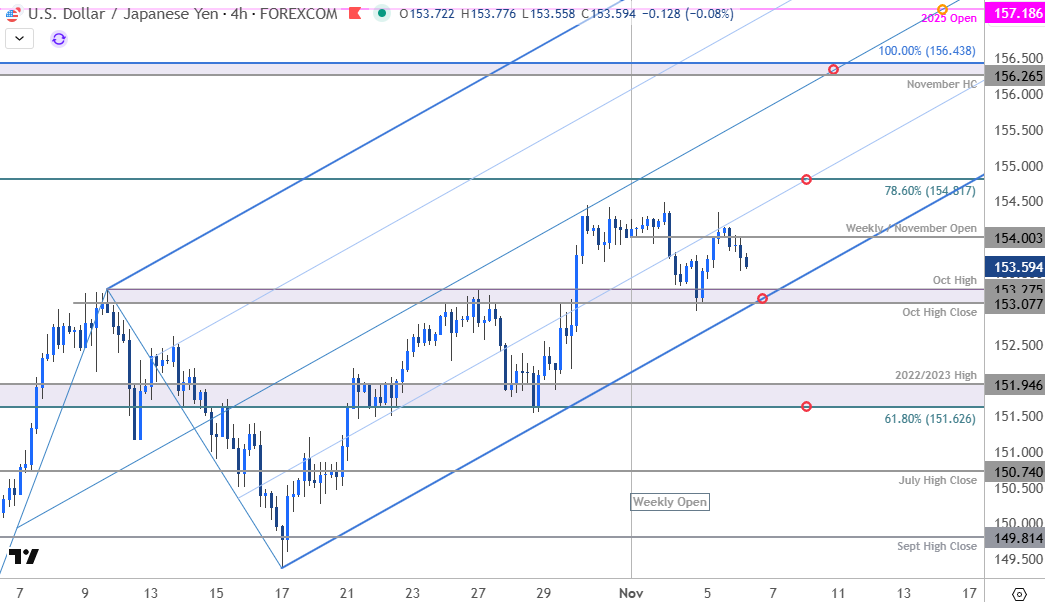
Chart Prepared by Michael Boutros, Sr. Technical Strategist; USD/JPY on TradingView
A closer look at Japanese Yen price action shows USD/JPY continuing to trade within the confines of an ascending pitchfork extending off the October lows. The lower parallel now converges on support at the October high-close / swing high at 153.08/27. A break / close below this threshold would threaten a larger correction towards key support (bullish invalidation) at 151.63/95- a region defined by the 61.8% retracement of the yearly range and the 2022 / 2023 swing highs. Look for a larger reaction there IF reached. Subsequent support seen at the July high-close at 150.74 and the September high-close at 149.81.
Initial resistance is eyed at the 78.6% retracement of at 154.82- note that the 75% parallel converges on this threshold next week and a breach / daily close above would be needed to mark resumption of the broader uptrend. Subsequent resistance objectives are eyed at the November high-close and the 100% extension of the April advance at 153.27/44 and the 2025 yearly open at 157.19.

Bottom line: USD/JPY is trading just below confluent resistance with the weekly and monthly opening-ranges now taking shape- look for the breakout in the days ahead. From a trading standpoint, losses should be limited to 151.63 IF price is heading higher on this stretch with a close above 154.82 needed to fuel the next major leg of the advance.
Note that economic data remains limited next week amid the ongoing government shutdown. Stay nimble early in the month and watch the weekly closes here for guidance. Review my latest Japanese Yen Weekly Forecast for a closer look at the longer-term USD/JPY technical trade levels.
Economic Calendar - latest economic developments and upcoming event risk.
--- Written by Michael Boutros, Sr Technical Strategist
Follow Michael on X @MBForex

