


Japanese Yen Technical Forecast: USD/JPY Short-term Trade Levels
- USD/JPY surges more than 4.4% off the monthly lows- six-day rally stalls just below monthly high
- USD/JPY outlook remains constructive while above August high- Fed / BoJ rate decisions on tap
- Resistance 153.08/27 (key), 153.83, 154.82- Support 151.62/94, 150.88/91 (key), 149.18
The Japanese Yen continues to weaken with USD/JPY rallying for a sixth consecutive day on Friday. The advance is testing a key technical hurdle as traders look ahead to next week’s Federal Reserve and Bank of Japan rate decisions — two events likely to drive volatility into the monthly open. While the broader outlook remains constructive, the immediate focus is on how price reacts to this resistance zone as bulls attempt to maintain control. Battle lines drawn on the USD/JPY short-term technical charts.
Japanese Yen Price Chart – USD/JPY Daily

Chart Prepared by Michael Boutros, Sr. Technical Strategist; USD/JPY on TradingView
Technical Outlook: In my last Japanese Yen Short-term Outlook, we noted that, “The USD/JPY breakout is testing near-term uptrend resistance– risk for possible inflection here. From a trading standpoint, a good zone to reduce portions of long-exposure / raise protective stops- losses should be limited to 150.88 IF price is heading high on this stretch with a close above the upper parallel needed to fuel the next major leg of the advance.” USD/JPY plunged more than 2.5% off the monthly high in the following days with price briefly registering an intraday low at 149.38 before rebounding sharply higher. A V-shaped recovery off those lows is now testing resistance at the October highs and the focus is on a reaction off this mark as we head into next week’s Fed rate decision.
Japanese Yen Price Chart – USD/JPY 240min
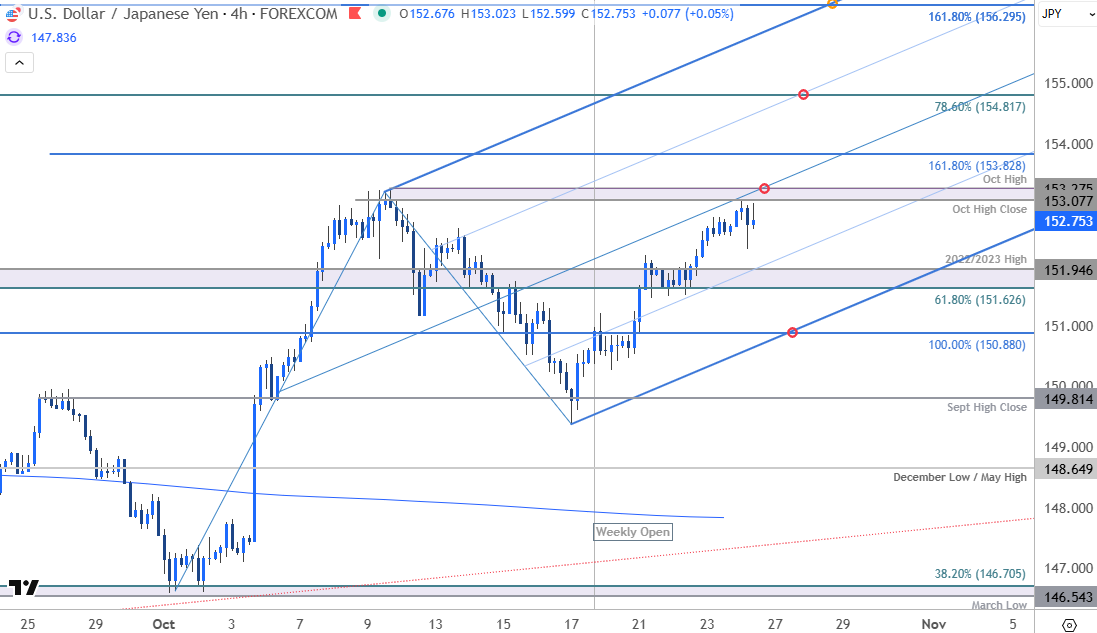
Chart Prepared by Michael Boutros, Sr. Technical Strategist; USD/JPY on TradingView
A closer look at Japanese Yen price action shows USD/JPY trading within an ascending pitchfork extending off the October lows with price exhaustion just ahead of the median-line on Friday. Note that this slope now converges on the October high-close and the monthly high at 153.08/27. A break/ daily close above this threshold is needed to fuel the next leg of the advance with subsequent resistance objectives eyed at the 1.618% extension of the September rally at 153.83 and the 78.6% retracement of the 2025 yearly range at 154.82. The next major technical consideration is eyed at the November high-close / 1.618% extension of the April advance at 156.26/29- look for a larger reaction there IF reached.
Initial support rests at 151.63/95- a region defined by the 61.8% retracement and the 2022/2023 swing highs. Near-term bullish invalidation remains with the 100% extension April rally / August high at 150.88/92. Note that the lower parallel converges on this threshold early next week and a break / daily close below would be needed to suggest a more significant high is in place / a larger reversal is underway. Subsequent support seen at the September high-close at 149.81 and the December low /May high at 148.65.

Bottom line: The USD/JPY is trading just below resistance at the monthly highs ahead of major event risk next week. From a trading standpoint, a good zone to reduce portions of long-exposure / raise protective stops- losses would need to be limited to 150.88 IF price is heading higher on this stretch with a close above 153.27 needed to fuel the next leg of this advance.
Keep in mind we get the release of the Federal Reserve & Bank of Japan (BoJ) interest rate decisions next week and we could see a surge of volatility heading into the monthly cross. Stay nimble into the releases and watch the weekly closes for guidance. Review my latest Japanese Yen Weekly Forecast for a closer look at the longer-term USD/JPY technical trade levels.
USD/JPY Key Economic Data Releases
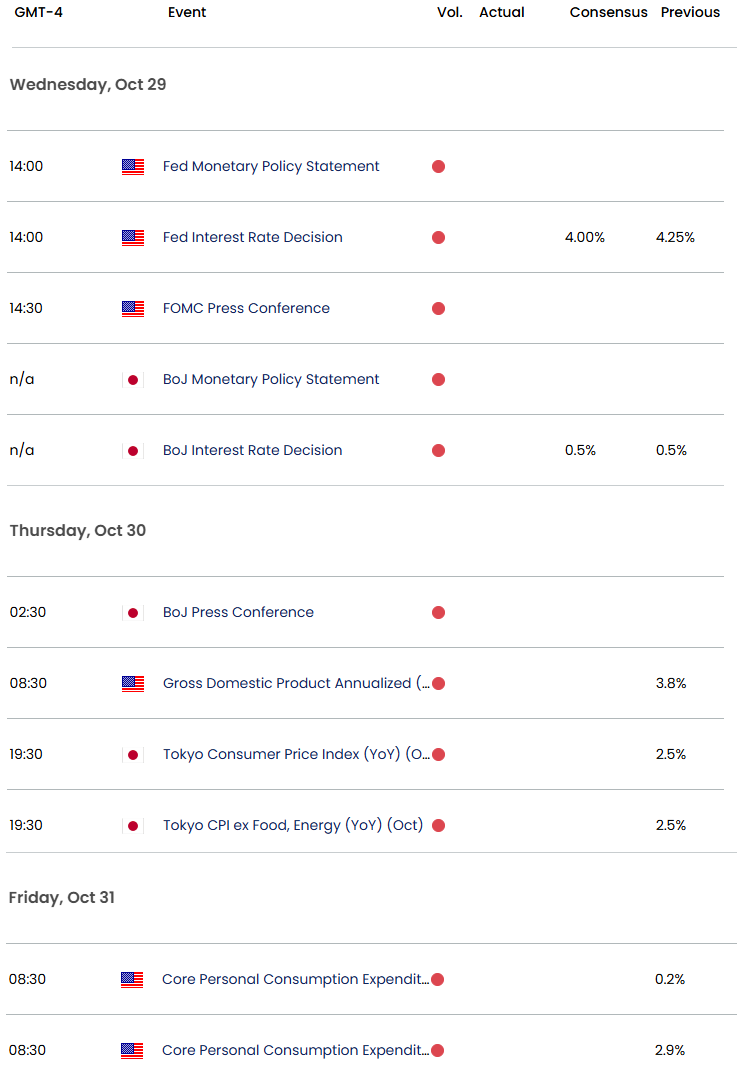
Economic Calendar - latest economic developments and upcoming event risk.
--- Written by Michael Boutros, Sr Technical Strategist
Follow Michael on X @MBForex


