
The Bank of Japan raised rates as expected, but market reaction once again highlighted the disconnect between BOJ guidance and trader sentiment. With the yen weakening and OIS markets grinding higher, the question now is whether the BOJ will follow through in 2026 or continue its slow-moving approach to policy normalisation.
View related analysis:
- USD/JPY Wrongfoots Bears Ahead of BoJ, Nikkei Looks in Trouble
- USD/JPY and AUD/JPY Test Key Support as Japanese Yen Strengthens
- Japanese Yen Technical Outlook: USD/JPY, CHF/JPY, AUD/JPY
- Japanese Yen Weakness Lifts USD/JPY and EUR/JPY while Nikkei Holds 50k
BOJ hikes to a three-decade high
The Bank of Japan (BOJ) hiked their interest rate by 25bp to a three-decade high of 0.75%. While this is low by most central bank standards, it is of course high by Japan’s. Still, the move was fully expected given the return of inflation, and in some ways still seen as daring given the new Prime Minister’s larger-than-expected fiscal stimulus and the dovish expectations of the BOJ.
The hike was arguably more hawkish than expected, with the statement saying that further hikes may be necessary if inflation and growth estimates continue to materialise. Perhaps more importantly, it stated that interest rates remain significantly low, which could pave the way for Governor Ueda to strike a more hawkish tone in his press conference shortly. But given his established track record of sounding more dovish than the central bank’s statement, there seems to be little room for a hawkish surprise that could result in a meaningful rise in yen strength.

Yen weakens despite the hawkish tilt
Despite the hawkish undertone to today’s hike, the Japanese yen was broadly weaker. Given the BOJ’s slow response to changing economic conditions, the lack of any timing regarding future hikes means traders do not see imminent hikes as a real threat, selling the yen as a consequence. It is all down to Ueda as to whether we’ll see a stronger or weaker yen from here; if he backs up the statement with hawkish rhetoric, the yen could strengthen sharply and topple USD/JPY, while failure to do so could see USD/JPY continue higher.
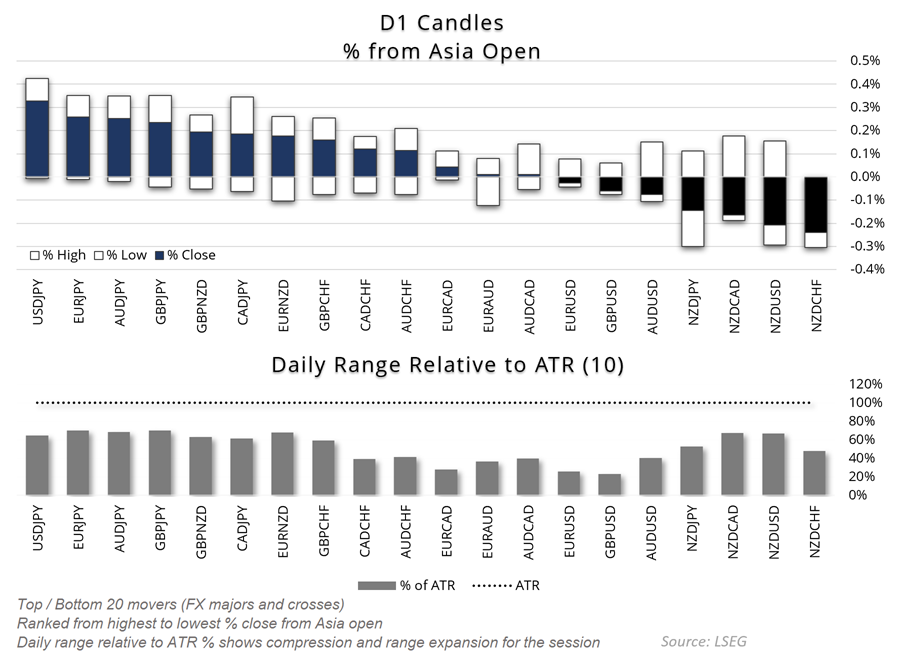
Chart analysis by Matt Simpson - Source: LSEG
As things stand, estimates are for the BOJ to next hike around June or July, increasing rates once or twice to a terminal rate of 1% to 1.25%. This is hardly setting the currency world alight, and that is being reflected in yen weakness. While a weaker yen does of course increase the risk of intervention, it is more likely to occur if the yen weakens too quickly. The MOF keep a closer eye on levels of volatility over absolute levels, though the latter does of course still count.
The overnight index swap (OIS) curve continues to trend higher alongside rising expectations of another BOJ hike. Yet with the 1-year at just 0.86%, it provides little conviction of an overly hawkish central bank. And until we see the BOJ spring into decisively hawkish action, yen bulls may continue to be disappointed.
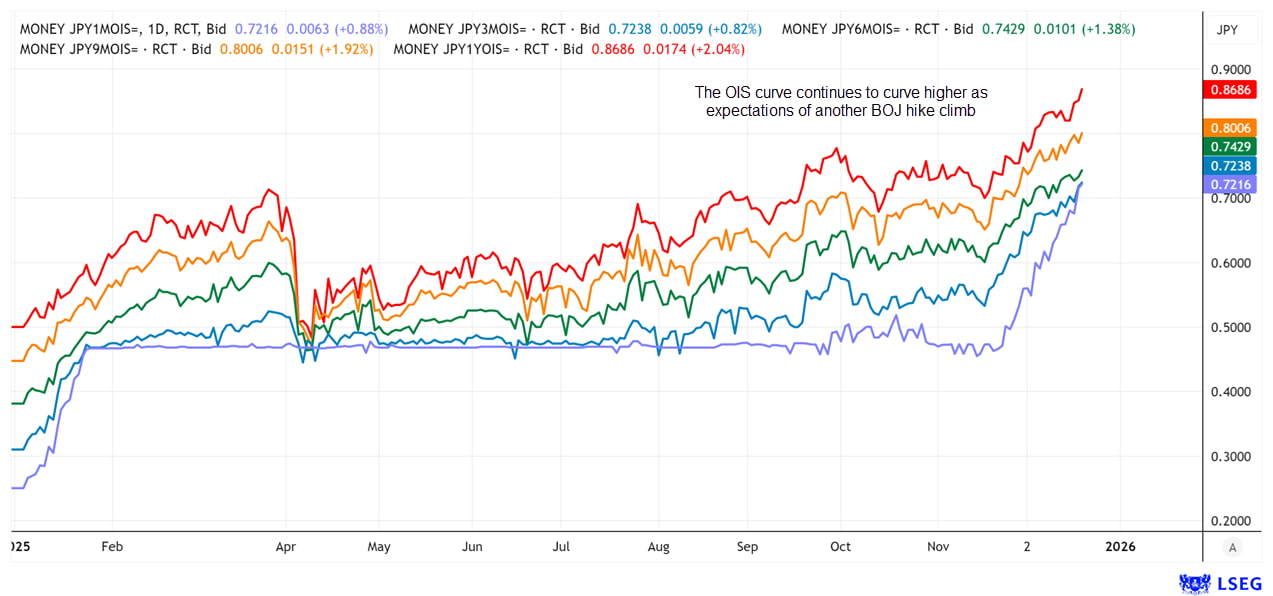
Chart analysis by Matt Simpson - Source: LSEG
USD/JPY Technical Analysis: US Dollar vs Japanese Yen
The weaker yen has allowed USD/JPY to reach my 156 target ahead of Ueda’s speech. And it could continue higher if I am correct in assuming Ueda will remain frustratingly cautious with his tone. This could see USD/JPY break above the 156.17 highs and clear a way for a move to the 157 handle.
However, the more volatile move for USD/JPY could be the downside should Ueda come out swinging with hawkish rhetoric, with a move below 155 being likely. A break beneath the 154.34 low opens up a run down towards the 100% projection level at 153.30.
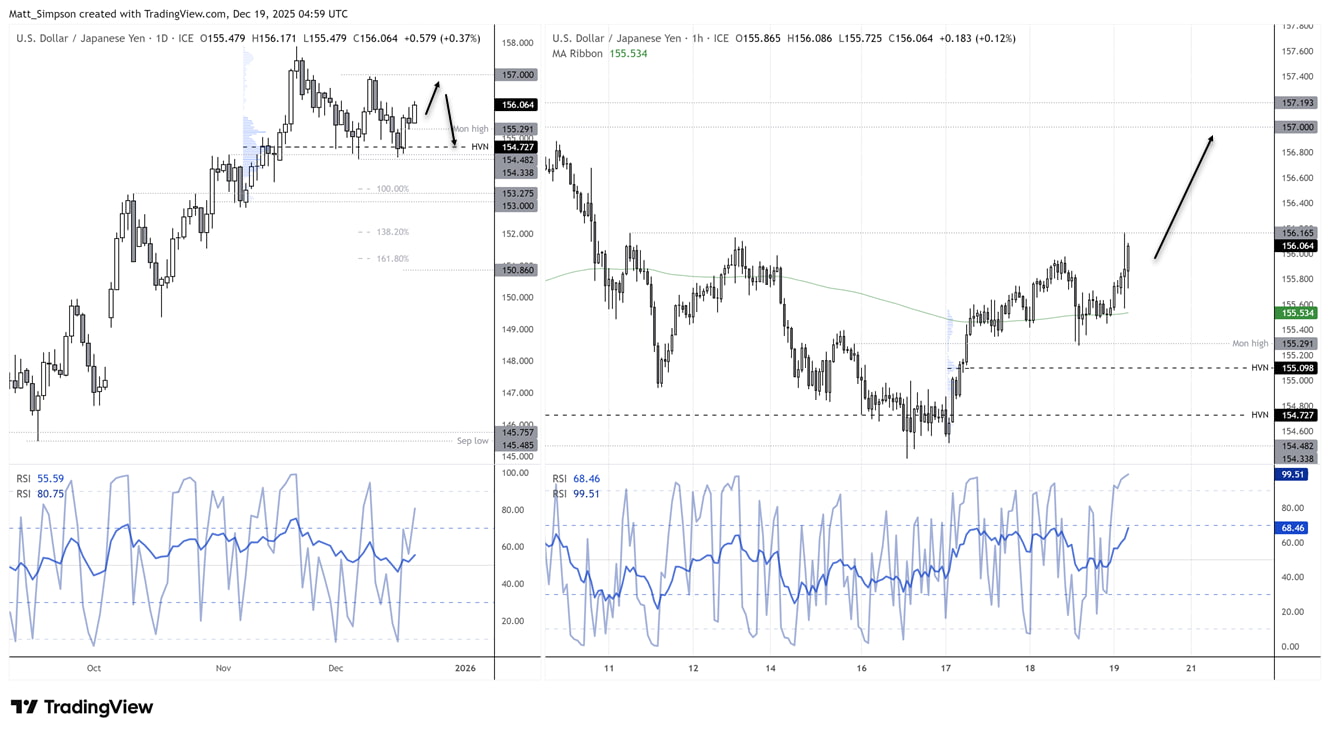
Chart analysis by Matt Simpson - Source: TradingView / ICE
View the full economic calendar
-- Written by Matt Simpson
Follow Matt on Twitter @cLeverEdge
How to trade with City Index
You can trade with City Index by following these four easy steps:
- Open an account, or log in if you’re already a customer
• Open an account in the UK
• Open an account in Australia
• Open an account in Singapore
- Search for the market you want to trade in our award-winning platform
- Choose your position and size, and your stop and limit levels
- Place the trade