
The Japanese yen and Swiss franc were the weakest FX majors on Monday, supporting the bullish biases I outlined last week on USD/JPY and USD/CHF. USD/CHF has climbed to an 8-day high and now trades roughly 30 pips below my 0.81 upside target. Momentum has also turned higher on USD/JPY, consistent with last week’s bullish view.
GBP/JPY broke to a 16-month high and now sits just 40 pips beneath its July 2024 peak.
NZD/JPY reached a 13-month high, while AUD/JPY hit a 17-month high ahead of today’s RBA meeting, where a hawkish hold is expected.
The US dollar index is holding above last week’s lows and printed a bullish candle on Monday, though meaningful follow-through is still lacking. That could change later this week if the Fed proves less dovish than some expect.
View related analysis:
- US Dollar Shows Signs of Stability Into PCE Inflation: USD/JPY, USD/CHF
- USD/JPY, Nikkei Outlook: Japanese Yen Weakens amid Risk-On Tone
- Australian Dollar Outlook: AUD/USD Extends Rally Into RBA, FOMC
- ASX 200 Market Outlook: Santa’s Rally Arrives Early for Materials
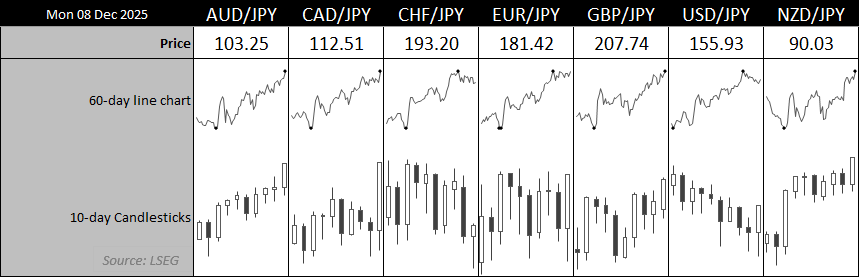
Chart analysis by Matt Simpson - data source: LSEG
USD/JPY Technical Analysis: US Dollar vs Japanese Yen
The daily chart on the left shows that bulls have finally made their presence felt on USD/JPY after an 11-day correction from the November high. Two bullish hammers formed on Thursday and Friday around the October high, accompanied by a bullish divergence on the RSI(2). The RSI(14) also held above 50 throughout the pullback and is now turning higher.
Importantly, USD/JPY continued to close above the 155 handle — a level many traders consider sensitive for potential MOF scrutiny. Historically, though, intervention risk rises more on disorderly volatility than on any specific price level.
The 1-hour chart on the right shows a developing bullish trend, marked by higher highs and higher lows while price continues to respect the 10-bar EMA as dynamic support. USD/JPY looks set to test the weekly R1 pivot at 156.20 and the high-volume node near 156.35. Whether it can break and sustain above these levels will likely depend on how hawkish the market perceives the upcoming FOMC meeting. A clean break above 156.50 would open the door for a run towards the 157 handle.
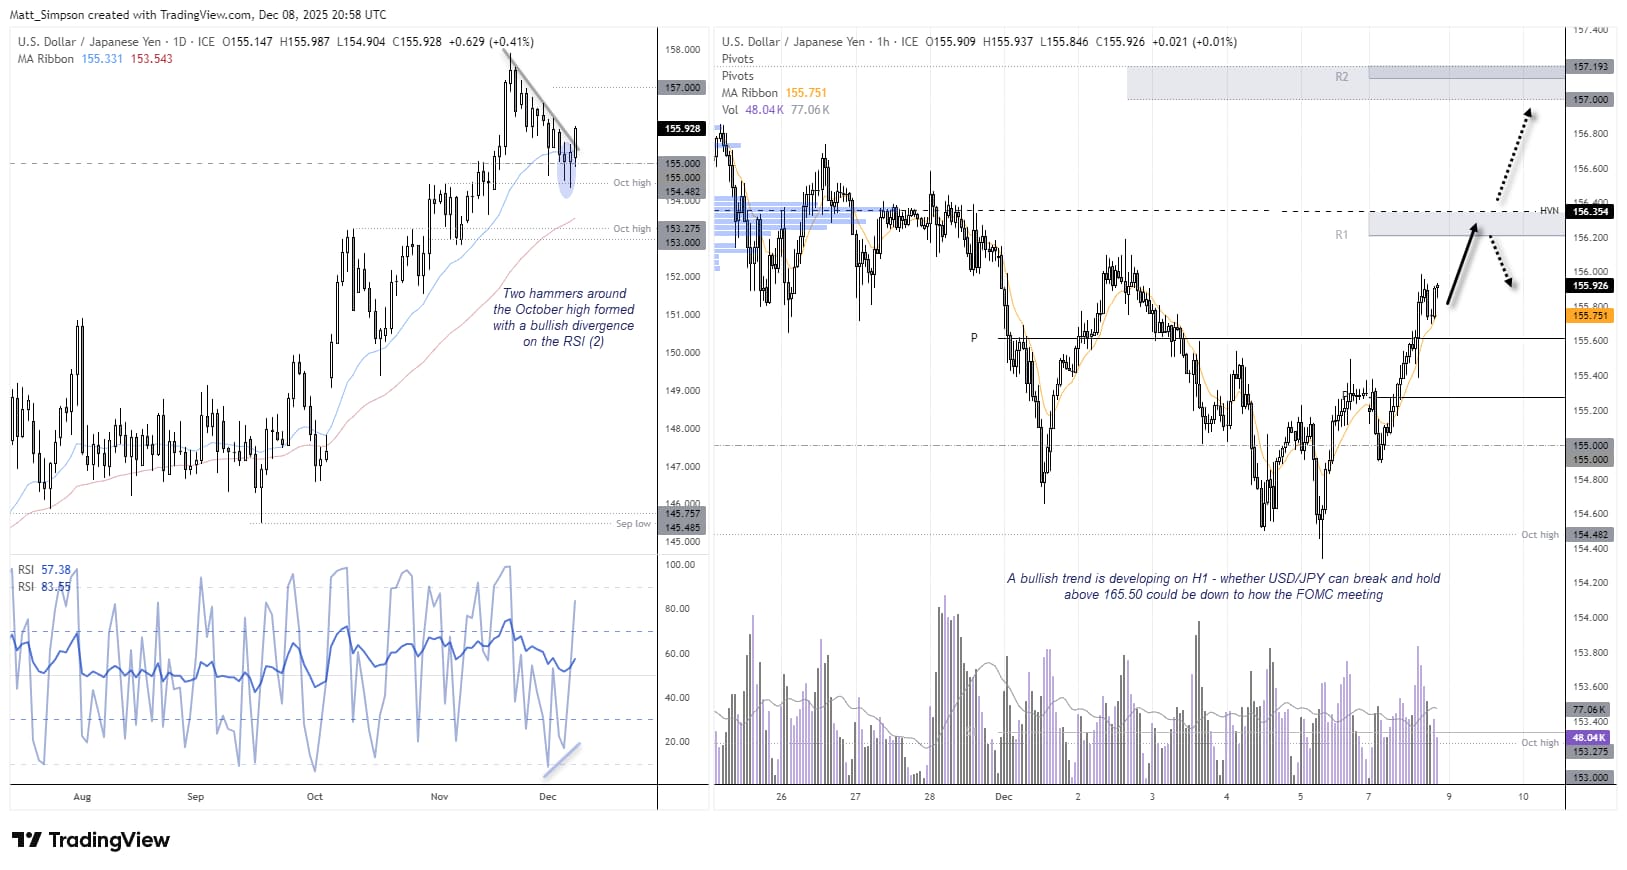
Chart analysis by Matt Simpson - data source: TradingView USD/JPY

EUR/JPY Technical Analysis: Euro vs Japanese Yen
The euro remains in a strong uptrend against the yen, with momentum turning higher after a bullish continuation pattern on the EUR/JPY daily chart. The symmetrical triangle now projects an upside target just above the 183 handle, aligning with the monthly R1 pivot at 183.46. The daily RSI(14) also remains comfortably above 50 and is curling higher without entering overbought territory.
EUR/JPY is also trending higher on the 1-hour chart, with price now pressing against the weekly R1 pivot and the recent swing high at 181.52. A clean break above this zone would shift focus towards the November high at 182.00 and the weekly R2 pivot at 182.15, with the symmetrical triangle target further above.
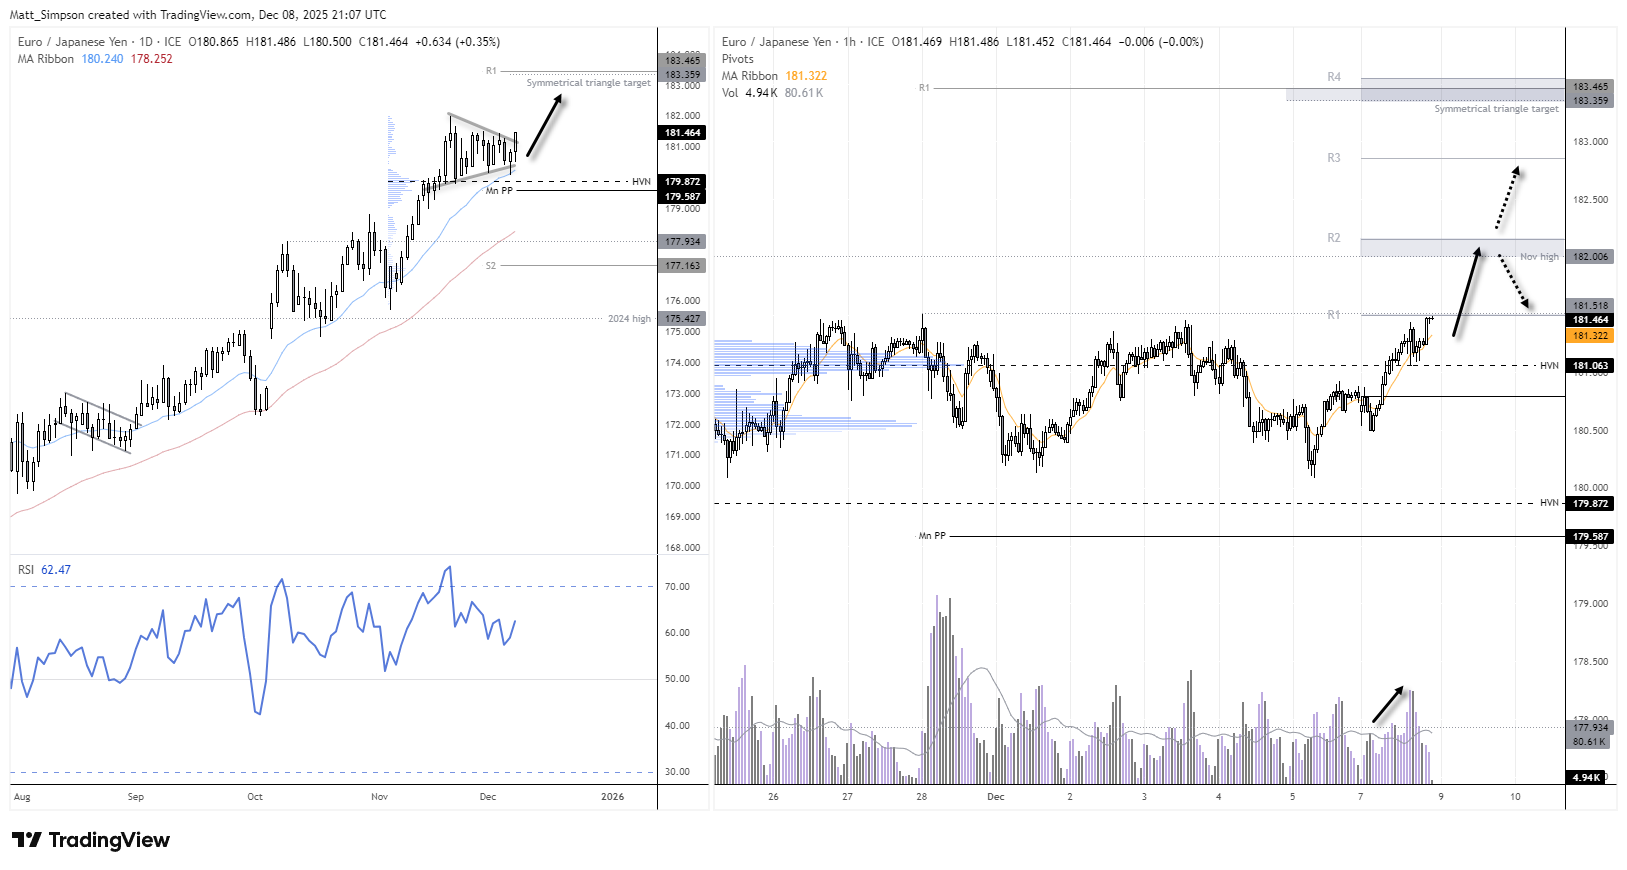
Chart analysis by Matt Simpson - data source: TradingView EUR/JPY

Nikkei 225 Futures (NK) Technical Analysis
While the 10-day correlation between USD/JPY and the Nikkei is virtually flat at 0.1 — and still low at 0.4 over 20 days — correlations are inherently lagging. The 60-day reading, however, is very strong at 0.9. With USD/JPY pushing higher and the Nikkei holding elevated levels, the risk is that shorter-term correlations begin to tighten again.
The daily chart shows that, despite short-term noise, USD/JPY and the Nikkei tend to move broadly in tandem over time.
Rising volumes supported the two-day bullish breakout on the Nikkei last week, while volume has since tapered off as prices consolidate above the 20-day EMA and the 50k handle within what appears to be a developing pennant/flag pattern. Bulls may seek pullbacks into last week’s range or towards the 20-day EMA, positioning for a potential continuation towards the 52k area.

![]() Chart analysis by Matt Simpson - Source: TradingView, Nikkei Futures (NKD1!)
Chart analysis by Matt Simpson - Source: TradingView, Nikkei Futures (NKD1!)
View the full economic calendar
-- Written by Matt Simpson
Follow Matt on Twitter @cLeverEdge
How to trade with City Index
You can trade with City Index by following these four easy steps:
- Open an account, or log in if you’re already a customer
• Open an account in the UK
• Open an account in Australia
• Open an account in Singapore
- Search for the market you want to trade in our award-winning platform
- Choose your position and size, and your stop and limit levels
- Place the trade