
The Nasdaq 100 has held up remarkably well despite a multi-month pullback, suggesting underlying strength remains intact. With momentum now turning higher from support, traders are weighing whether this marks a short-term bounce or the resumption of the broader bull trend. The upcoming FOMC meeting is a key risk event, but several leading stocks are already showing signs of life.
View related analysis:
- ASX 200 Market Outlook: Grinds Higher, but Momentum Still Fragile
- US Dollar Outlook: FOMC Decision Meets Crude Oil Price Shock
- Wall Street Futures Feel the Heat of Crude Oil Surge
- ASX 200 Outlook: Oil, Yields and Global Equities Drive Market Risk
- Nasdaq 100, S&P 500 Outlook: Nvidia Strength Runs Into Resistance
Nasdaq 100 Outlook: Bullish Momentum Builds as GOOG, MSFT and RKLB Show Strength
Nasdaq 100 Futures (NQ) Technical Analysis
The weekly chart shows a long-legged doji formed around the November low and the 50-week EMA. Momentum has turned higher so far this week, while a bullish divergence on the RSI (2) formed in the oversold zone alongside last week’s low.
That said, the FOMC meeting remains a key risk event that could trigger two-way volatility in the near term. For now, my bias remains bullish while the Nasdaq holds above the 24,215 low.
The daily chart shows Nasdaq futures have risen for two days and now back above 25k, though volumes were declining. If the Fed are less dovish via higher inflation forecasts or revised dot plot, it could prompt a pullback over the near term.
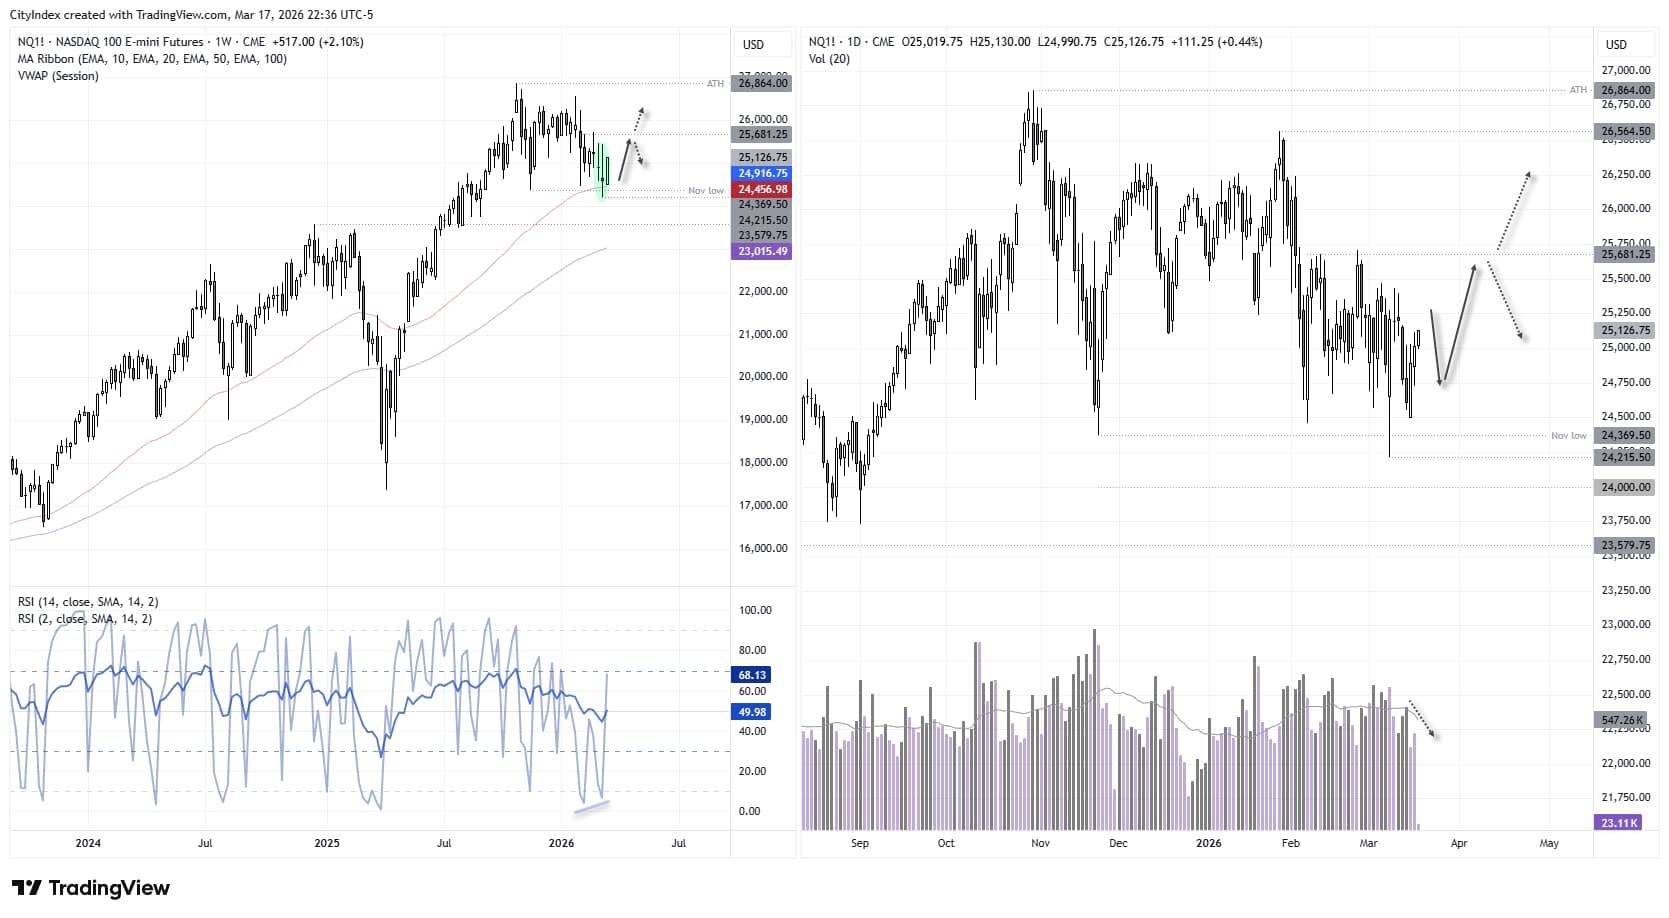
Source: CME, TradingView
Alphabet (GOOG), Microsoft (MSFT) Technical Analysis
While price action on the broader index remains choppy with hues of bullishness, it could take some time for stocks to rally or fall in harmony. But there are two stocks I am watching for potential rebounds, such as Alphabet GOOG on the daily chart and MSFT on the weekly.
Alphabet (GOOG) Holds Key Support as Momentum Turns Higher
A bullish engulfing candle on March 9 suggests GOOG is not ready to break below 300. Looking back to November, the 292–297 zone has provided solid support after flipping from resistance in prior weeks. A minor pullback last week also saw prices hold above 300 and the 300-day EMA, with momentum now turning higher.
Bulls may be treated to a shallow pullback towards 300, although a break above the 50-day EMA would favour bullish continuation and bring 320 into focus. A sustained move above that level could then open the door to 340.
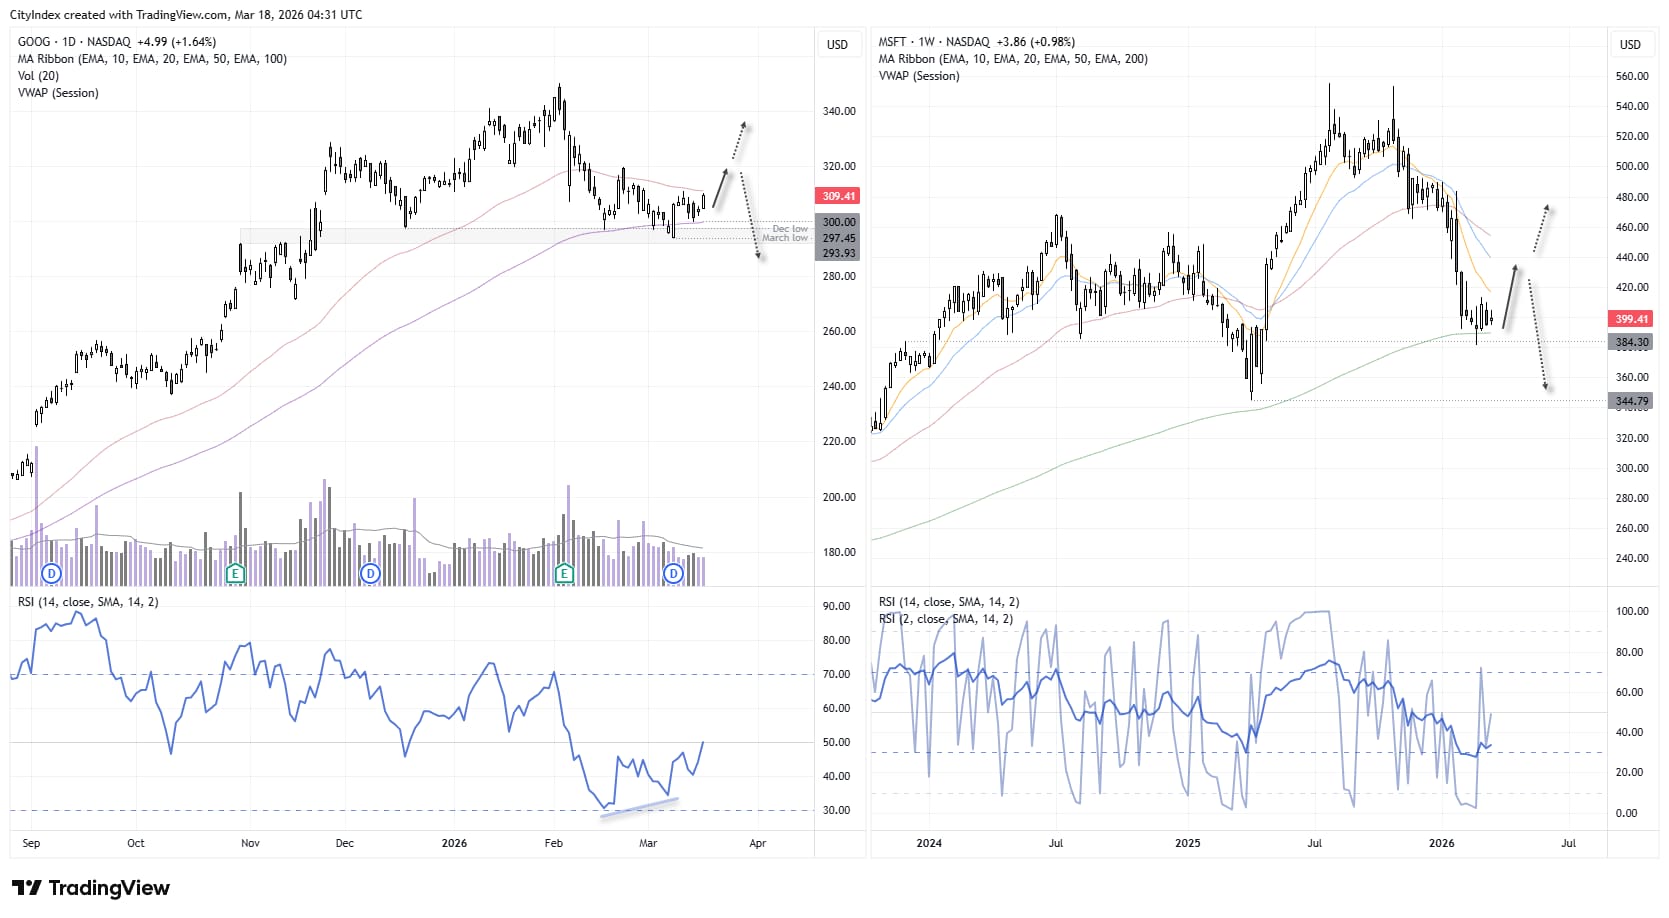
Source: NASDAQ, TradingView
Microsoft (MSFT) Stabilises Above Key Support as Bounce Risk Builds
Microsoft may require more patience, but the weekly chart is offering early clues of a potential bounce. The stock has already seen a sharp pullback from its double top, yet it has since entered a consolidation phase above the 200-week EMA.
A doji formed at the lows was followed by a bullish range-expansion week, while the subsequent bullish inside week suggests the stock was not yet ready to rally. However, with volatility subsiding and prices holding above support, MSFT likely requires a fresh bearish catalyst to break lower.
Bulls could consider dips towards the 200-day EMA on the assumption of a countertrend bounce. As is often the case at such inflection points, the reasons for a move tend to follow price action rather than precede it.

Rocket Lab Corporation (RKLB) Technical Analysis
It was a solid day of gains for RKLB on Tuesday as investors reacted to progress on its Neutron rocket and a massive $816 million contract, signalling strong demand and improved future revenue visibility. While the company also announced an equity distribution agreement for up to $1 billion of common stock — implying the risk of future dilution for shareholders — the Neutron rocket update and major contract were clearly the dominant drivers.
Bullish Trend Reasserts After Consolidation
The daily chart shows RKLB remains in a clear uptrend, with bullish range expansion bringing momentum back in line with its dominant trend after an extended period of support around its 100-day EMA. Given Tuesday’s rally was accompanied by strong volume, it suggests bullish initiation likely outweighed short covering.
Overbought Signals Hint at Near-Term Pullback
Tuesday’s high stalled just beneath the monthly R1 pivot, just below the 80 handle, while the RSI (2) reached overbought territory. This raises the risk of at least a minor pullback. The high-volume node from the prior consolidation sits just below 70, making dips towards this level attractive for bulls seeking re-entry.
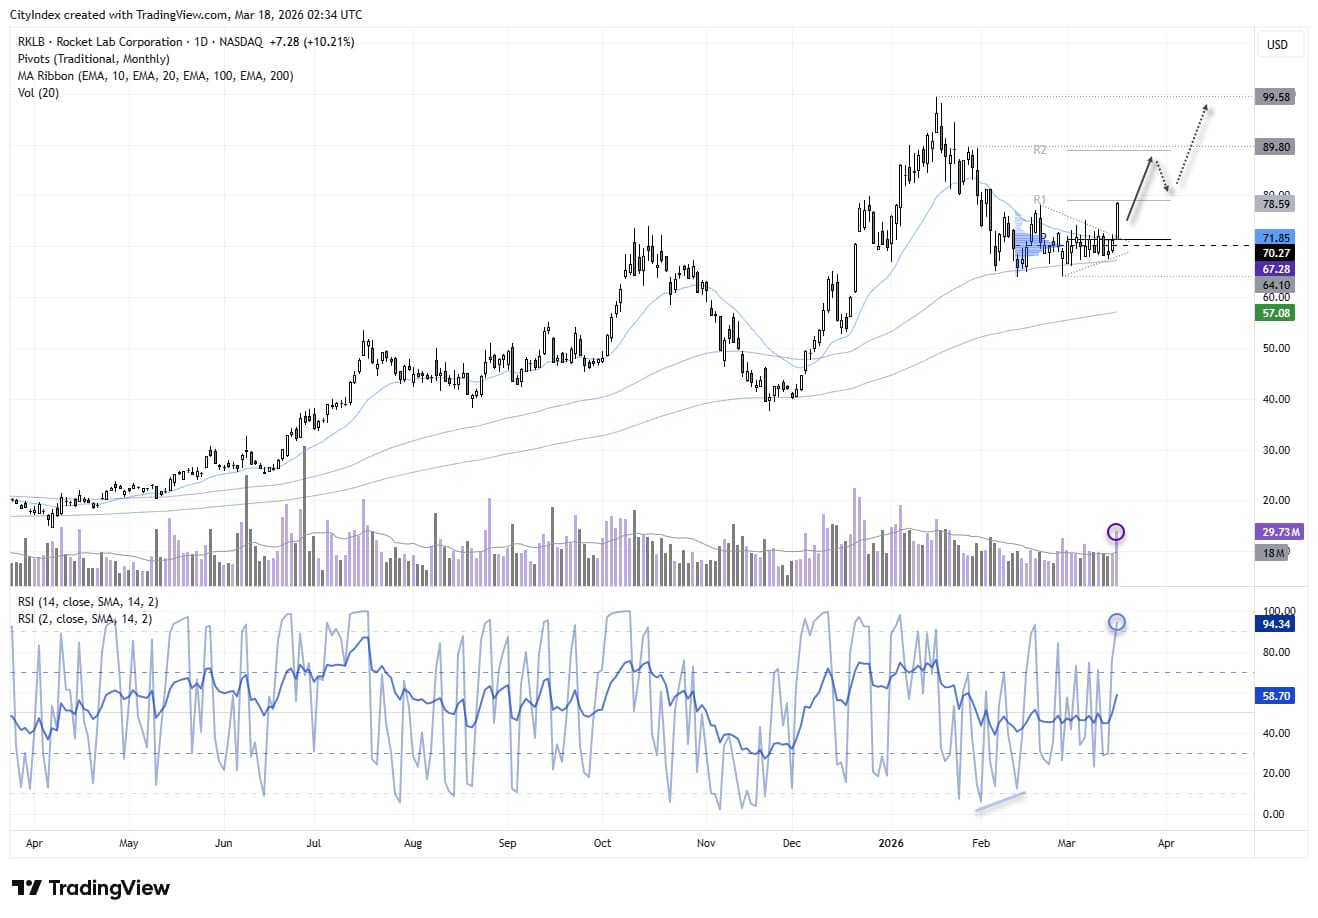
Source: NASDAQ, TradingView
View the full economic calendar
-- Written by Matt Simpson
Follow Matt on Twitter @cLeverEdge
How to trade with City Index
You can trade with City Index by following these four easy steps:
- Open an account, or log in if you’re already a customer
• Open an account in the UK
• Open an account in Australia
• Open an account in Singapore
- Search for the market you want to trade in our award-winning platform
- Choose your position and size, and your stop and limit levels
- Place the trade