


The Nasdaq 100 continues to outpace its Wall Street peers, extending gains to fresh record highs ahead of this week’s Federal Reserve policy decision. Bullish momentum remains firm, underpinned by steady bid accumulation on the Cumulative Volume Delta (CVD) and robust technical support from last week’s gap. With markets fully pricing in a 25bp rate cut, traders appear content to buy dips and maintain a risk-on stance into the Fed.
View related analysis:
- ASX 200 Morning Market Outlook: Bulls Lack Wall Street's Pace
- USD/JPY Hits Resistance, Implied Volatility Subdued Ahead of Fed, BOJ
- Bitcoin Bears At Risk of Short Squeeze Unless Prices Continue Lower
- Bitcoin, S&P 500 Outlook: Wall Street Volatility Rattles BTC
Nasdaq 100 Leads Wall Street Higher Ahead of the Fed
Wall Street indices have once again pushed to record highs, with this week’s catalyst coming from positive US–China trade deal headlines. The latest surge extends the Nasdaq’s rally from its 2009 low to nearly 600% (currently 596.4%), while the S&P 500 is up 548% and the Dow Jones has gained 533% over the same period.
In the near term, the US Tech 100 index continues to lead, with Nasdaq futures up 7.7% since the October low, compared with a 5.9% rise in the S&P and 5.3% on the Dow. The fact that all three indices are surging higher in tandem underscores how bullish Wall Street traders remain heading into this week’s Federal Reserve (Fed) interest rate decision.
Markets fully expect a 25bp cut, and if the Fed delivers a dovish tone as hoped, it could further support risk sentiment — a cue Wall Street traders seem unlikely to miss.

Wall Street Prices Diverge From Futures Volumes
Not content with closing at record highs on Friday, all three major Wall Street indies gapped higher on Monday to reach new highs by the close. Gaps during established trends can often be a strong continuation signal. Though it requires for gains to be direct and not close the said gaps.
But there is cause for concern looing at volume. Daily trading volumes have actually been declining for the past two weeks, despite prices continuing higher. Their 1-month cumulative delta volumes (CVD) are also trending lower to shows offers (sell orders) outnumbering bids (buy orders) over this period.
On the other hand, the CVD for Monday was positive to show buyers outnumbers sellers. The 1-month CVD is also curling higher on Nasdaq futures. And while the Nasdaq, S&P 500 and Dow Jones all closed above their upper keltner bands, I am inclined to see this as a bullish signal given prices gapped higher above their upper bands.
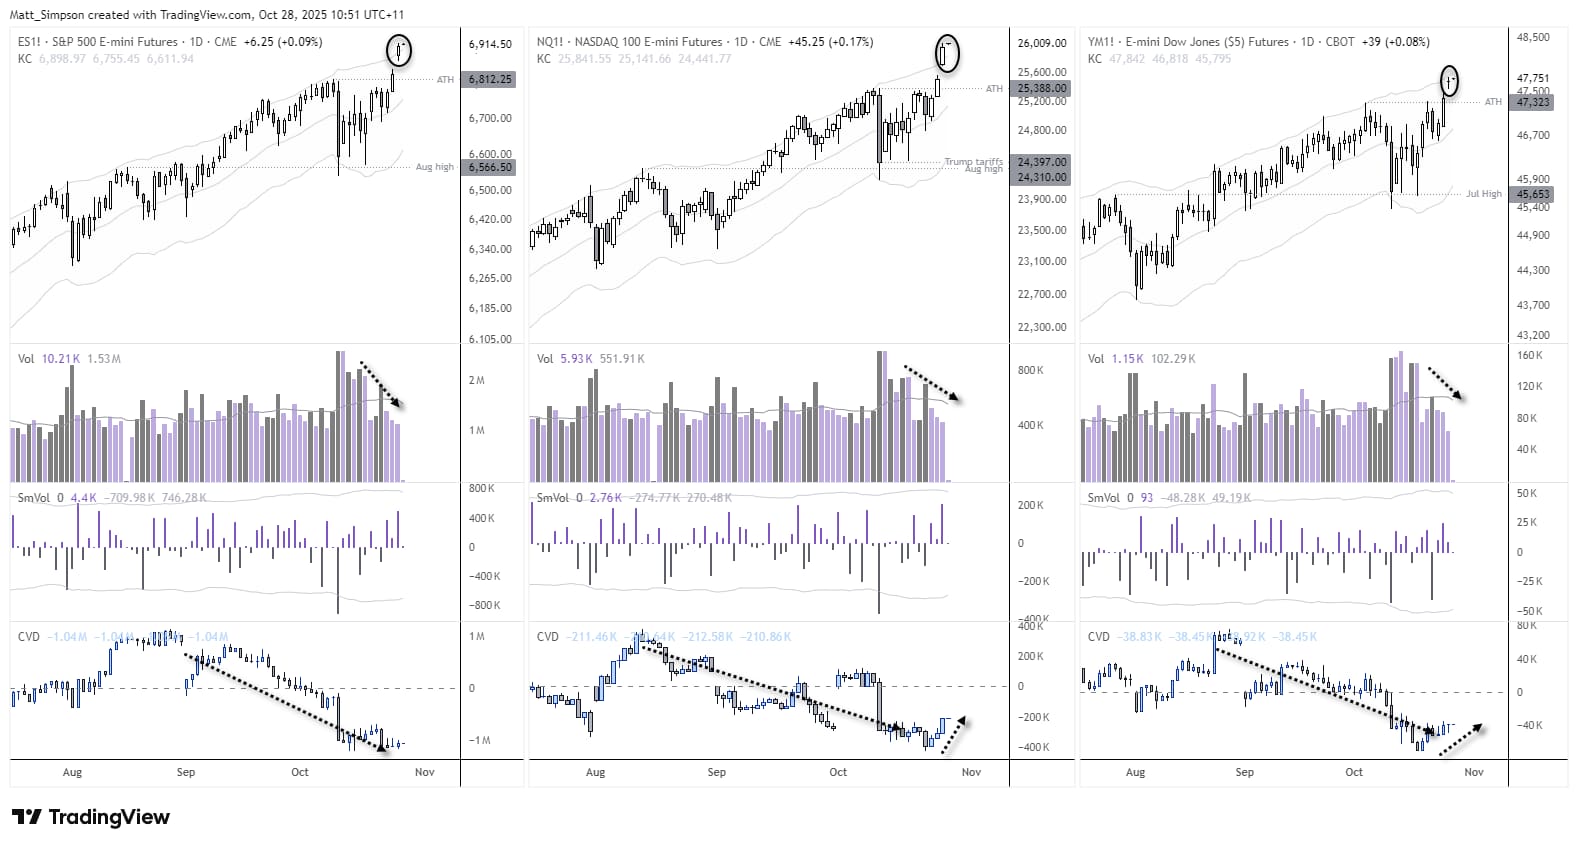
Chart analysis by Matt Simpson - Source: TradingView
Nasdaq Options Don’t Scream a Sentiment Extreme
Despite the Nasdaq 100’s runaway gains, its put–call ratio isn’t signalling an overbought market. The put–call ratio measures the volume of put options (bearish bets) relative to call options (bullish bets).
A reading near 1.0 suggests a balanced market, values above 1.0 indicate bearish sentiment (more puts than calls), and readings below 0.7 typically reflect bullish sentiment (more calls than puts).
The Nasdaq’s 1.05 put–call ratio therefore points to a balanced options market despite the index’s strong rally.
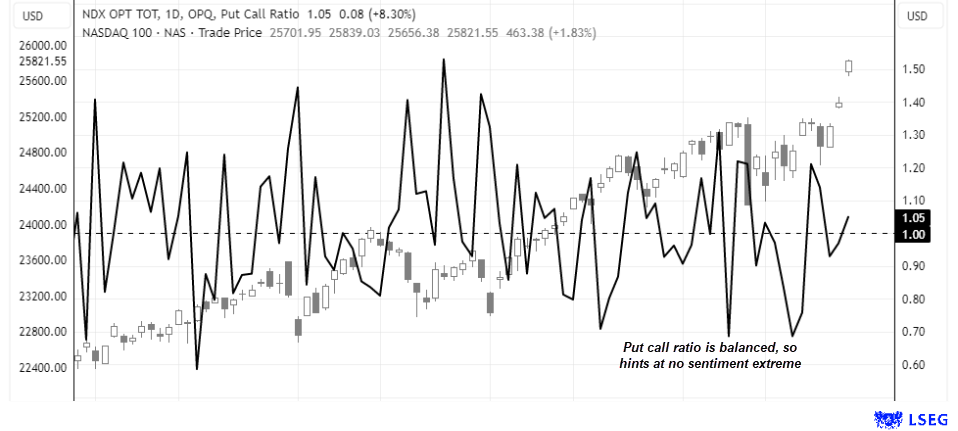
Chart analysis by Matt Simpson - Source: CME, LSEG

Nasdaq 100 Futures (NQ) Technical Analysis
The 1-hour chart shows prices accelerating above a rising channel, supported by increasing intraday volumes on Monday even as daily volumes trend lower overall. More importantly, the 1-hour Cumulative Volume Delta (CVD) has been trending higher since Wednesday, indicating steady accumulation of bids.
Bulls appear more inclined to buy dips at this stage, given the strong upthrust on the daily chart and a balanced put–call ratio. However, traders should note the weekly R2 pivot nearby as potential resistance, which could trigger a short-term pullback.
While the gap may not be filled immediately, it could provide support should prices retrace. For now, the bias remains for an eventual break above the weekly R2 pivot and a move toward R3 near 26,550.
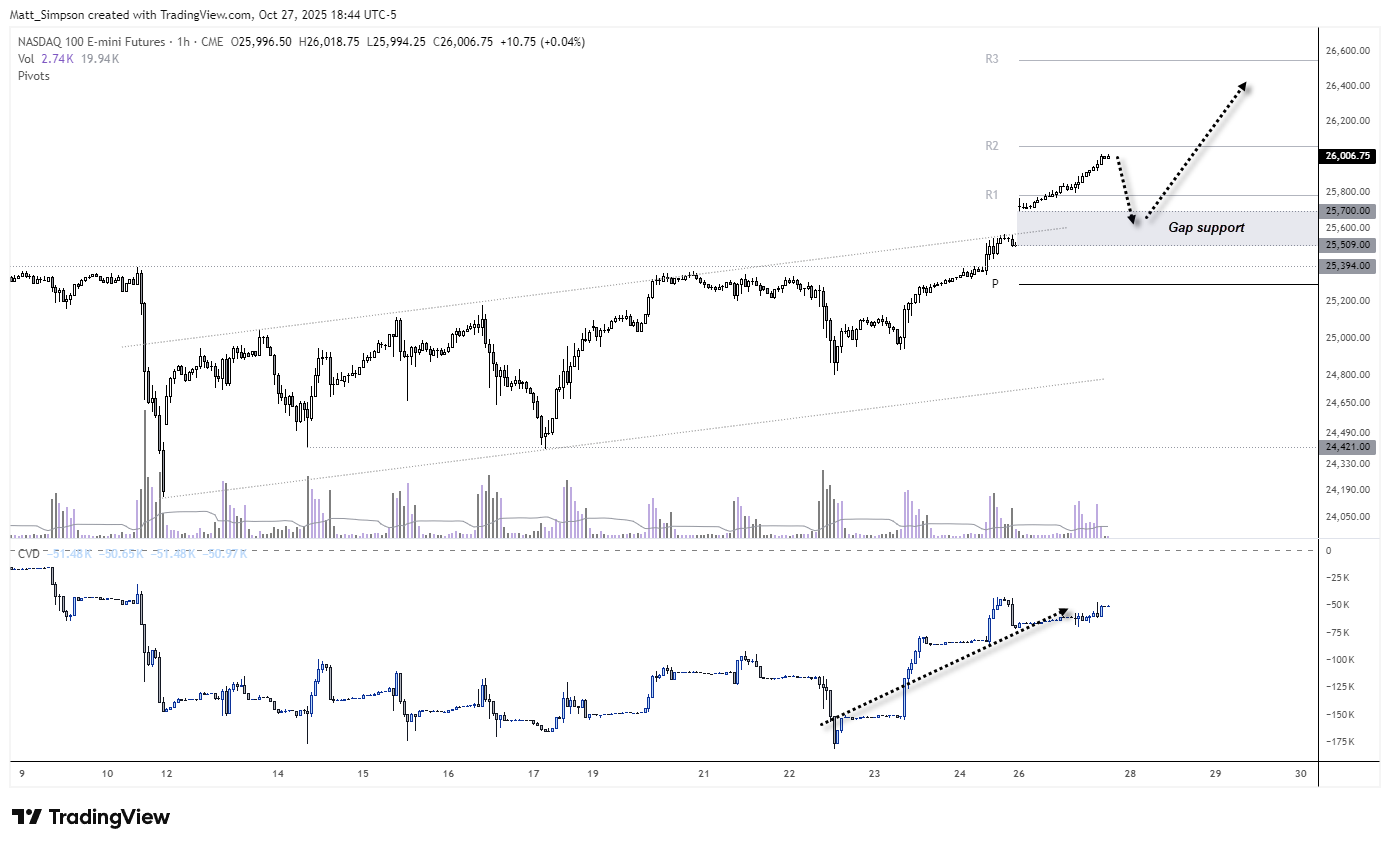
Chart analysis by Matt Simpson, Source: TradingView, CME Futures, NASDAQ 100 E-mini Futures
View the full economic calendar
-- Written by Matt Simpson
Follow Matt on Twitter @cLeverEdge
How to trade with City Index
You can trade with City Index by following these four easy steps:
- Open an account, or log in if you’re already a customer
• Open an account in the UK
• Open an account in Australia
• Open an account in Singapore
- Search for the market you want to trade in our award-winning platform
- Choose your position and size, and your stop and limit levels
- Place the trade


