


The Nasdaq 100 is pushing higher, but the rally is thin, low-volume and increasingly reliant on short covering. With the index now nearing major resistance and US data risk rising, several mega-cap names look vulnerable. Amazon, AMD and Tesla all show technical signs of fatigue — and each offers a clean setup if the broader Nasdaq stalls.
View related analysis:
- Nasdaq 100 Leads Wall Street, Meta Bounce Gains Traction
- US Dollar Seasonality in December: USD/JPY, USD/CHF, EUR/USD, AUD/USD
- Nasdaq Leads Wall Street Lower: Tesla Turns, Apple Sours
- Nvidia (NVDA) Earnings Stats for Nasdaq 100 Traders
Nasdaq 100: Bulls Push Higher but Resistance Looms
Nasdaq 100 Market Snapshot
- The Nasdaq 100 printed its seventh consecutive bullish candle on Tuesday — its strongest run in six months.
- The index has now rallied 7.4% from its recent lows and sits just 2.4% beneath its record high.
- Traders are focused on today’s ISM Services PMI, ADP payrolls, and this week’s PCE inflation data to gauge the Fed’s path — all of which could directly influence Wall Street and the US dollar.
- The SOX Semiconductor Index is up 1.8% this week, while the Bloomberg FAANG 2.0 Index is down 0.5% and Nasdaq Biotech is off 2.8%.
- Nasdaq futures are up 0.2%, with bulls eyeing a retest — and potential break — of the 12 November high at 25,830.

Chart analysis by Matt Simpson - data source: NYSE, LSEG

Nasdaq 100 Technical Analysis
The Nasdaq is attempting to rebound off its 20-week EMA, but the move is unfolding on very low volume — suggesting a lack of genuine bullish conviction and more of a short-covering bounce. By contrast, the prior three consecutive bearish weeks occurred on rising volume, with the third posting the highest turnover since April.
Daily momentum is pointing higher, but volume remains thin and notable resistance sits near 25,800. If that level caps the advance or momentum rolls over, I’ve identified three Nasdaq mega-cap stocks that warrant attention for potential bearish setups.

Chart analysis by Matt Simpson - data source: NYSE, LSEG
Amazon: AMZN Technical Analysis
Amazon remains in a broader uptrend, but price action has turned messy and increasingly questionable. The stock slid more than 16% from its record high over a three-week stretch and has since struggled to recover even half of those losses, underperforming the Nasdaq since the 15 November low.
The weekly chart highlights a multi-year bearish divergence, with momentum forming another divergence since July via a double-top structure. More importantly, the surge to record highs was accompanied by a large gap higher just two sessions before momentum turned — a classic “blow-off top” characteristic often seen near major peaks.
Support earlier this month appears to have been driven primarily by the 200-day SMA around 214. The latest rally has now stalled near the September high and still sits below the January peak. With the daily RSI(2) extremely overbought and a high-volume shooting-star candle in place, a swing high looks increasingly likely.
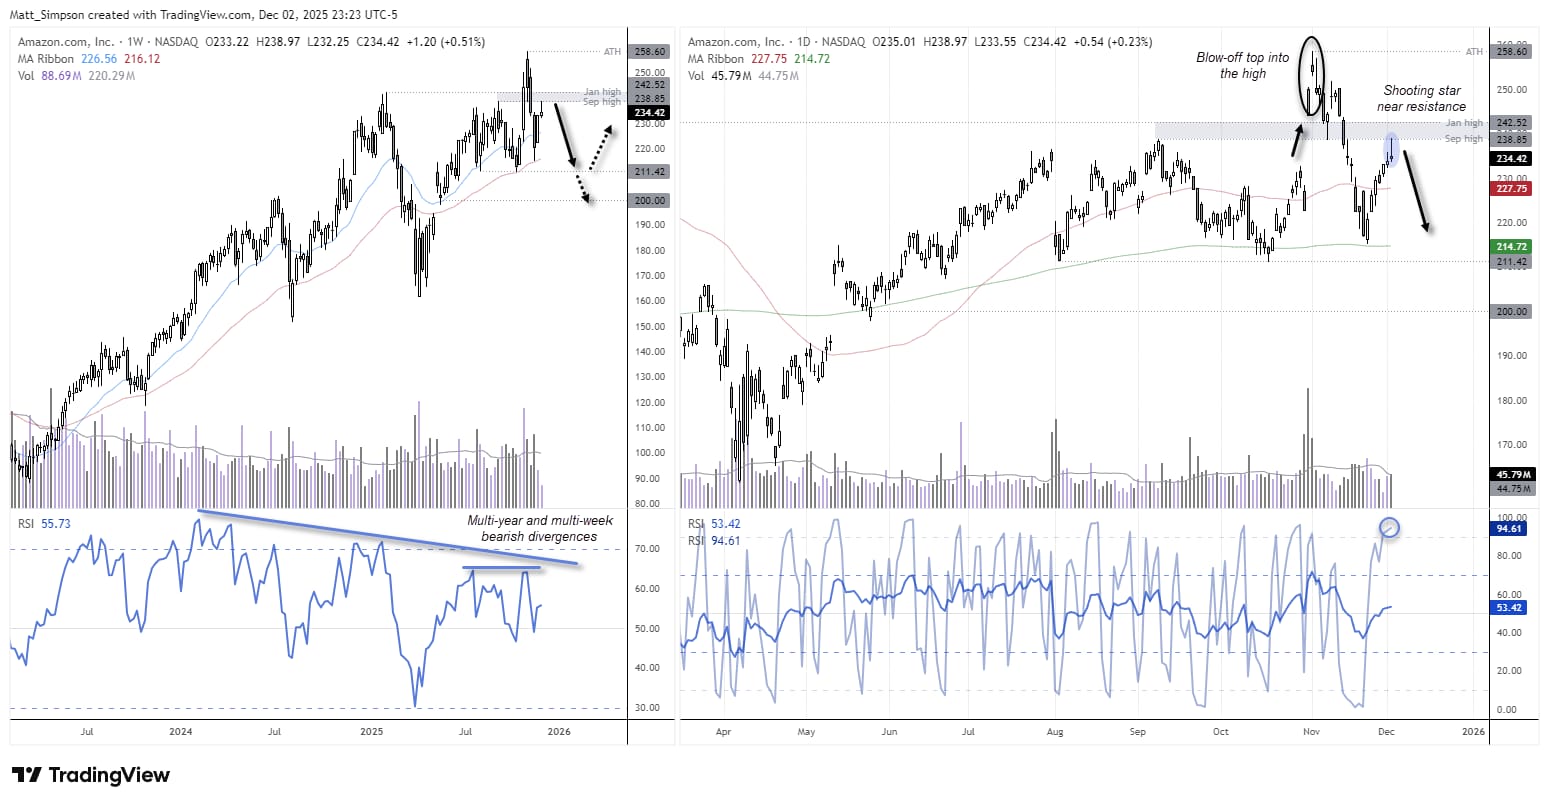
Chart analysis by Matt Simpson - data source: NYSE, TradingView

Advanced Micro Devices: AMD Rejection at Key Resistance Signals Further Downside
I suspect AMD is trying to close its gap around 170, which could leave a decline of ~20% from current levels.
A bearish divergence formed well in advance of the -27% decline for AMD from its highs. While we’ve seen it pop higher over the past week, the 50-day SMA has capped as dynamic resistance and momentum is trying to revert lower. A bearish engulfing candle formed on Tuesday around the monthly pivot point, 223.64 swing low and 50-day SMA.
Bears could target the 200 handle while prices remain beneath 230 (or Tuesday’s high). A break beneath the August high brings the 171.06 gap support level into focus for bears.
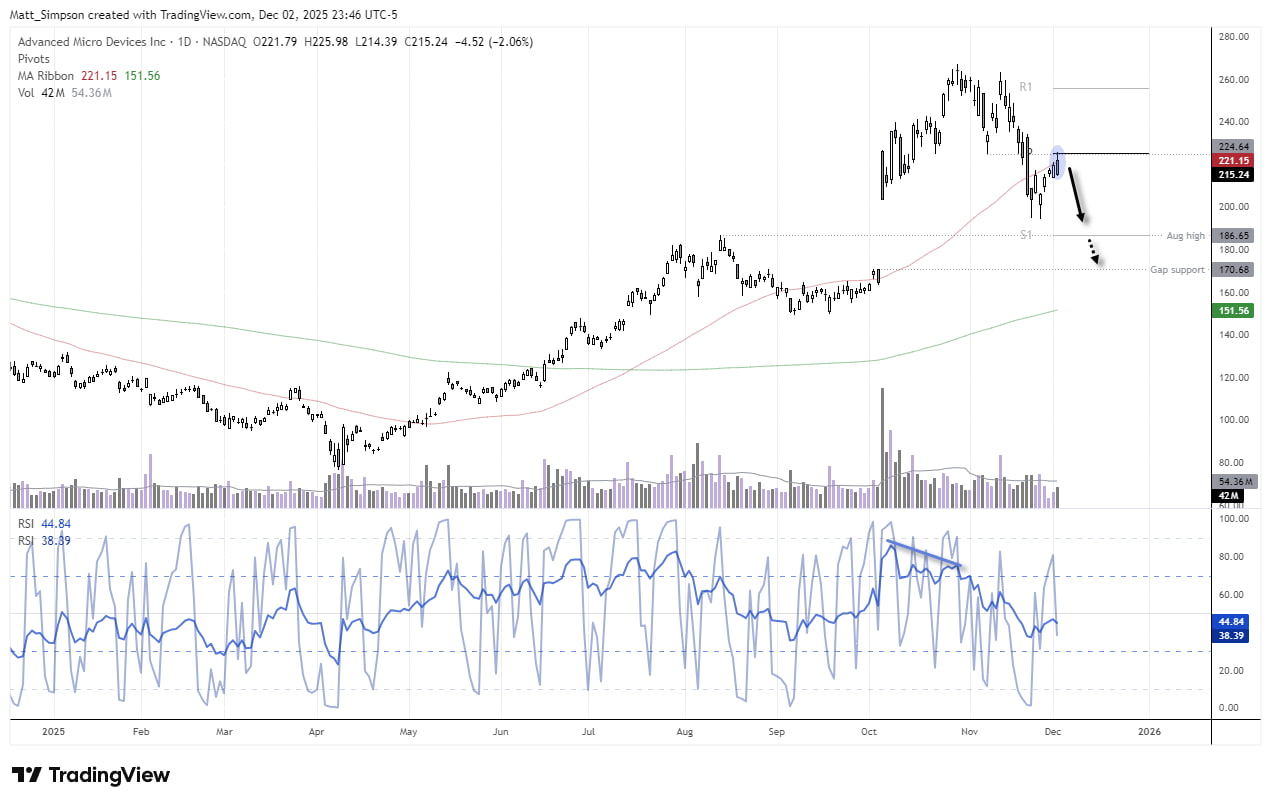
Chart analysis by Matt Simpson - data source: NYSE, TradingView
Tesla: TSLA Indecision at Resistance Hints at Pullback Risk
Tesla has rallied more than 13% from its double-bottom low above 380, but momentum is already showing signs of fatigue. A rickshaw-man doji formed on Tuesday, signalling indecision just as price met dual resistance at the 50-day SMA (433.93) and a high-volume node around 433.84.
Bears should wait for clearer confirmation before engaging — ideally a bearish engulfing candle or a daily close beneath 420. The next key support sits around 383, with a break below that level exposing the May high at 367.71.
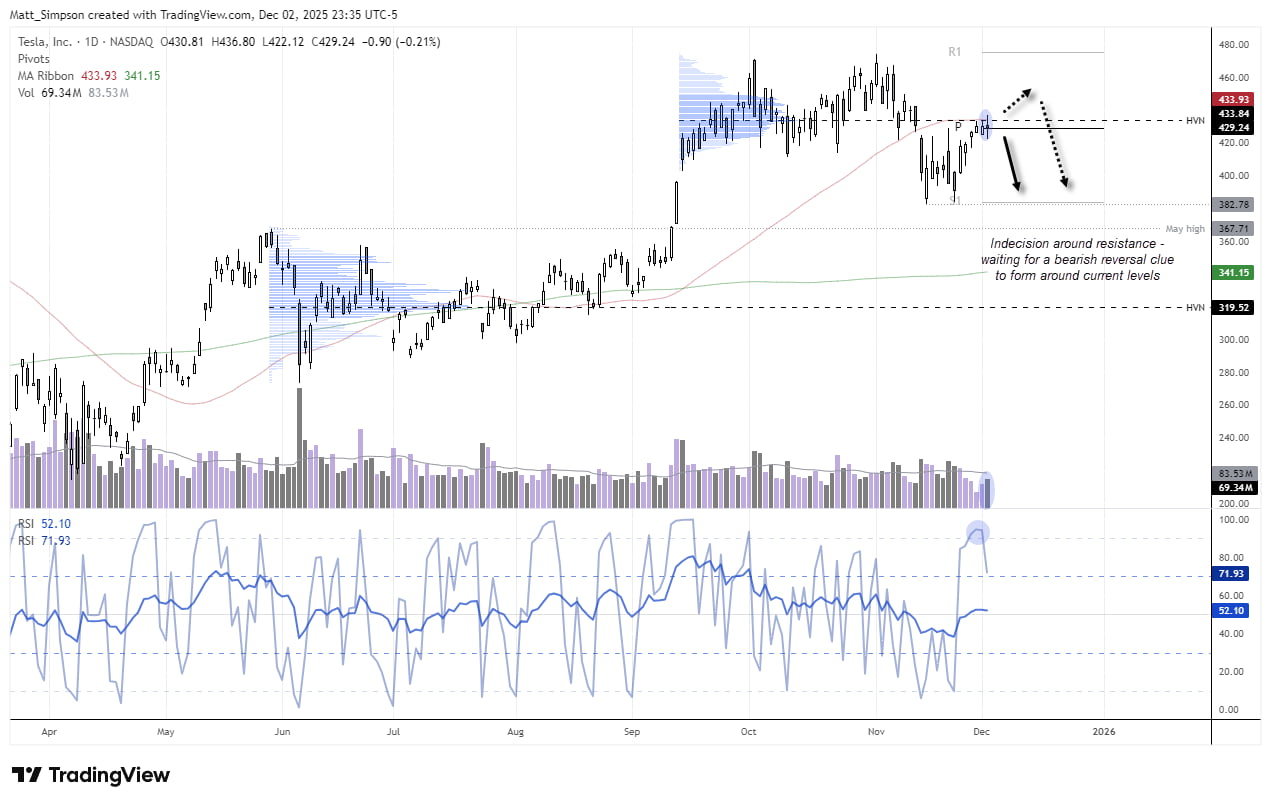
Chart analysis by Matt Simpson - data source: NYSE, TradingView
View the full economic calendar
-- Written by Matt Simpson
Follow Matt on Twitter @cLeverEdge
How to trade with City Index
You can trade with City Index by following these four easy steps:
- Open an account, or log in if you’re already a customer
• Open an account in the UK
• Open an account in Australia
• Open an account in Singapore
- Search for the market you want to trade in our award-winning platform
- Choose your position and size, and your stop and limit levels
- Place the trade


