

The leader has become the laggard. Despite fresh ATHs in both SPX and the Russell 2000 in 2026, the Nasdaq remains below the high set at the Fed’s October meeting. But – is that a sign of what’s to come or a simple scenario out of overbought stocks?
Starting this week a bearish blog post that circulated on social media over the weekend was widely credited with causing a sell-off in stocks. Even the Wall Street Journal penned an article attributing the move to the reality of what that blog post had pointed out, which was really just shining a light on the elephant in the room.
But two days later and the S&P 500 has jumped above last week’s levels and while the fear has dissipated from the headlines, at least a little bit, the awkward sense of unease remains in-place. The rally that started from the 2022 lows remains long-in-the-tooth for a number of issues, including a big one that’s reporting earnings in a few hours with NVDIA. And the dynamic shift over the past four months is undeniable as the Nasdaq 100 which was very much the leader both out of the 2022 lows and last year’s ‘Liberation Day’ lows has lagged behind both the S&P 500 and even the Russell 2000 index.
Both a positive and negative argument can be mustered by such a fact. On the positive side, stretched valuations got ahead of themselves in the premium AI names and we’ve simply seen a rotation of capital into lower valuations, boosted by the prospect of economic growth from both monetary and fiscal stimulus that could potentially help those lower valuation and small cap companies a bit more than their large cap tech brethren.
But, in the negative camp, this capital allocation can be argued as a late stage move with the larger push points for the rally now seemingly holding unattractively high valuations. And in that scenario it could just be a matter of time before more funds and traders are compelled to take profits off the table in anticipation of a rocky road ahead.
Earnings can have a sway on the matter, to be sure, but the fact of the matter is that positioning and sentiment are more dominant push points for price than pure fundamentals, as it takes supply and demand to dictate price movements.
If practically anyone willing and wanting to be long already is, well, even the brightest news report in the world can fail to muster adequate demand. And the very nature of a market not moving up when it probably otherwise would have can create enough concern to cause at least some longs to cut bait, which leads to supply and lower prices.
It’s rare that this happens like a light switch getting turned off because pullbacks and support tests will often bring out latent bullish behavior, leading to demand and a bounce which can bring on higher prices. But as we reapproach prior highs – and as bulls get more and more skittish of testing resistance or holding for another breakout, we can begin to see lower-highs post and that can be an early warning sign that a deeper retracement might be near.
In the Nasdaq 100, we’ve had that stalling near the highs after the high that was set at the October 29th Fed rate decision. Since then – the index has been in a significant grind with buyers unable to continue the rally that ran for more than 60% from trough to peak last year.
Nasdaq 100 Futures – Daily Chart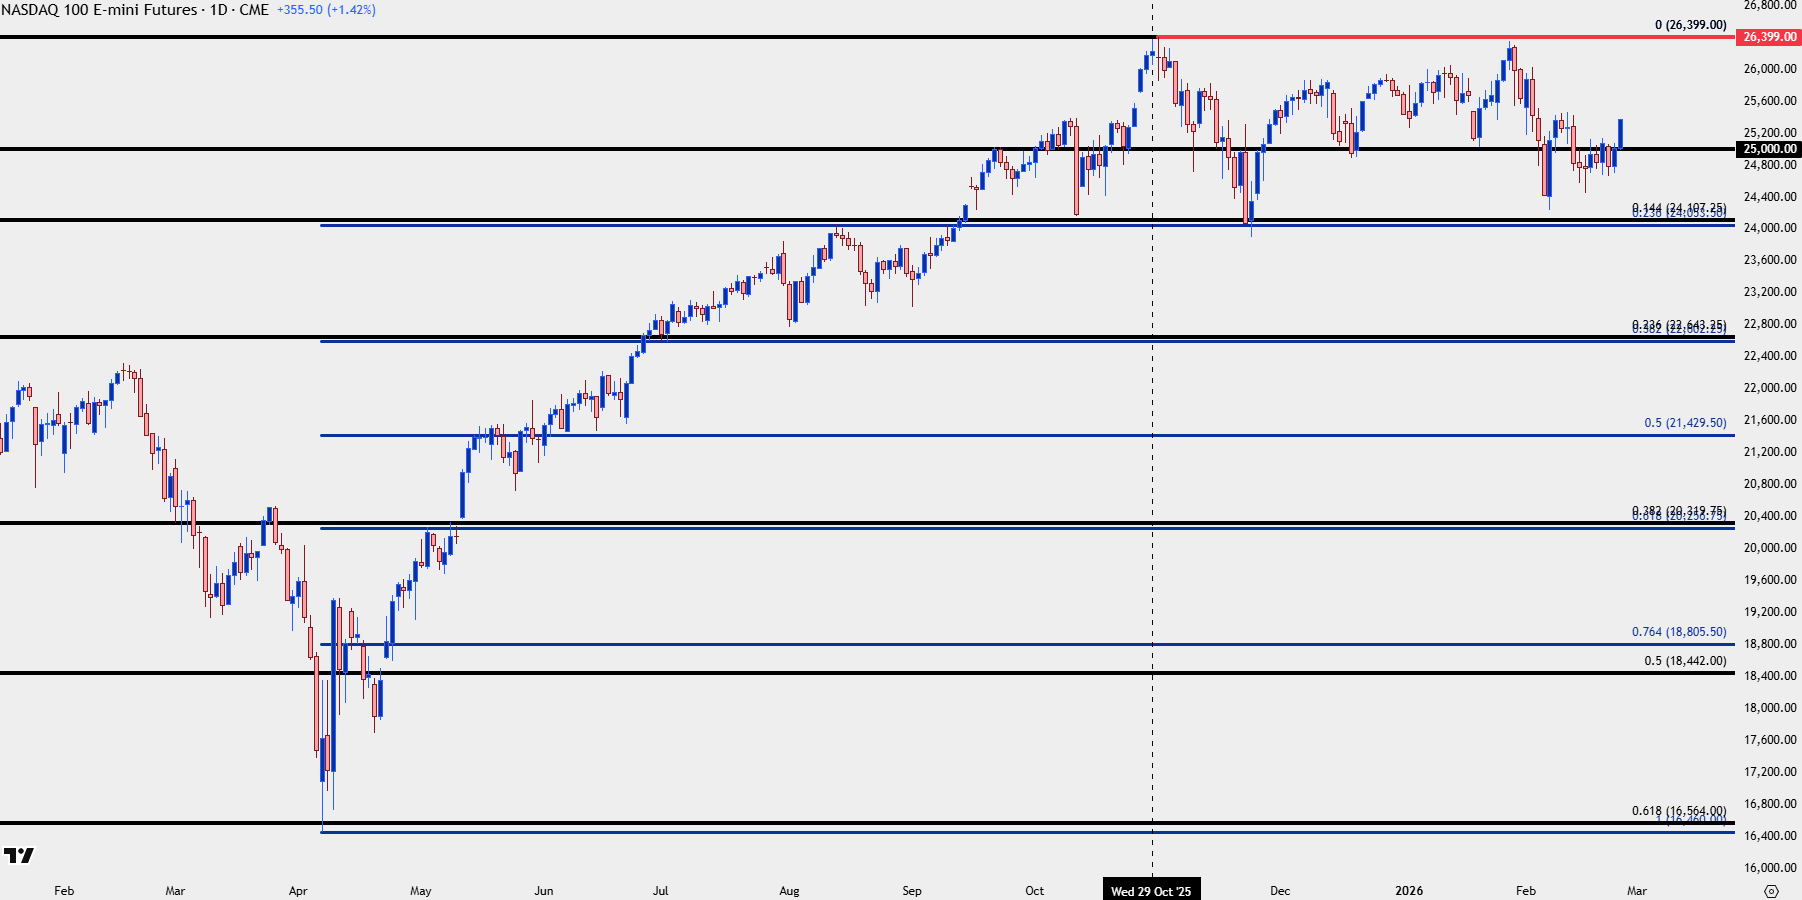
Chart prepared by James Stanley; data derived from Tradingview
Delay Doesn’t Mean Doom
It’s easy to look at the life cycle of that trend last year and then ascribe a negative outcome. After all, the initial rise is clear as is the slowing of that rally; and, logically, the next step would be a sell-off or retracement. That negative scenario can be strengthened with deduction given that we’ve had both a dovish Fed and a strong push from fiscal policy and neither have really been able to help the long side of the tech-heavy index.
But, the reality is each pullback has so far been bid fairly well, with the October pullback finding support at a confluent area of Fibonacci levels and then the January/February pullback seeing buyers come in to hold the lows above that price. So, it’s still far too early to call this a doom scenario just yet.
But – with that being said, the stalling at highs also illustrates the danger of chasing a well-developed trend and, instead, points to the power of prudence and patience in looking for or waiting for a pullback. With today’s breakout above the 25k level, there’s even a price that can remain of interest for such, as traders can look for support potential at prior resistance, which would also offer closer proximity to recent lows for risk structuring.
Nasdaq 100 Daily Price Chart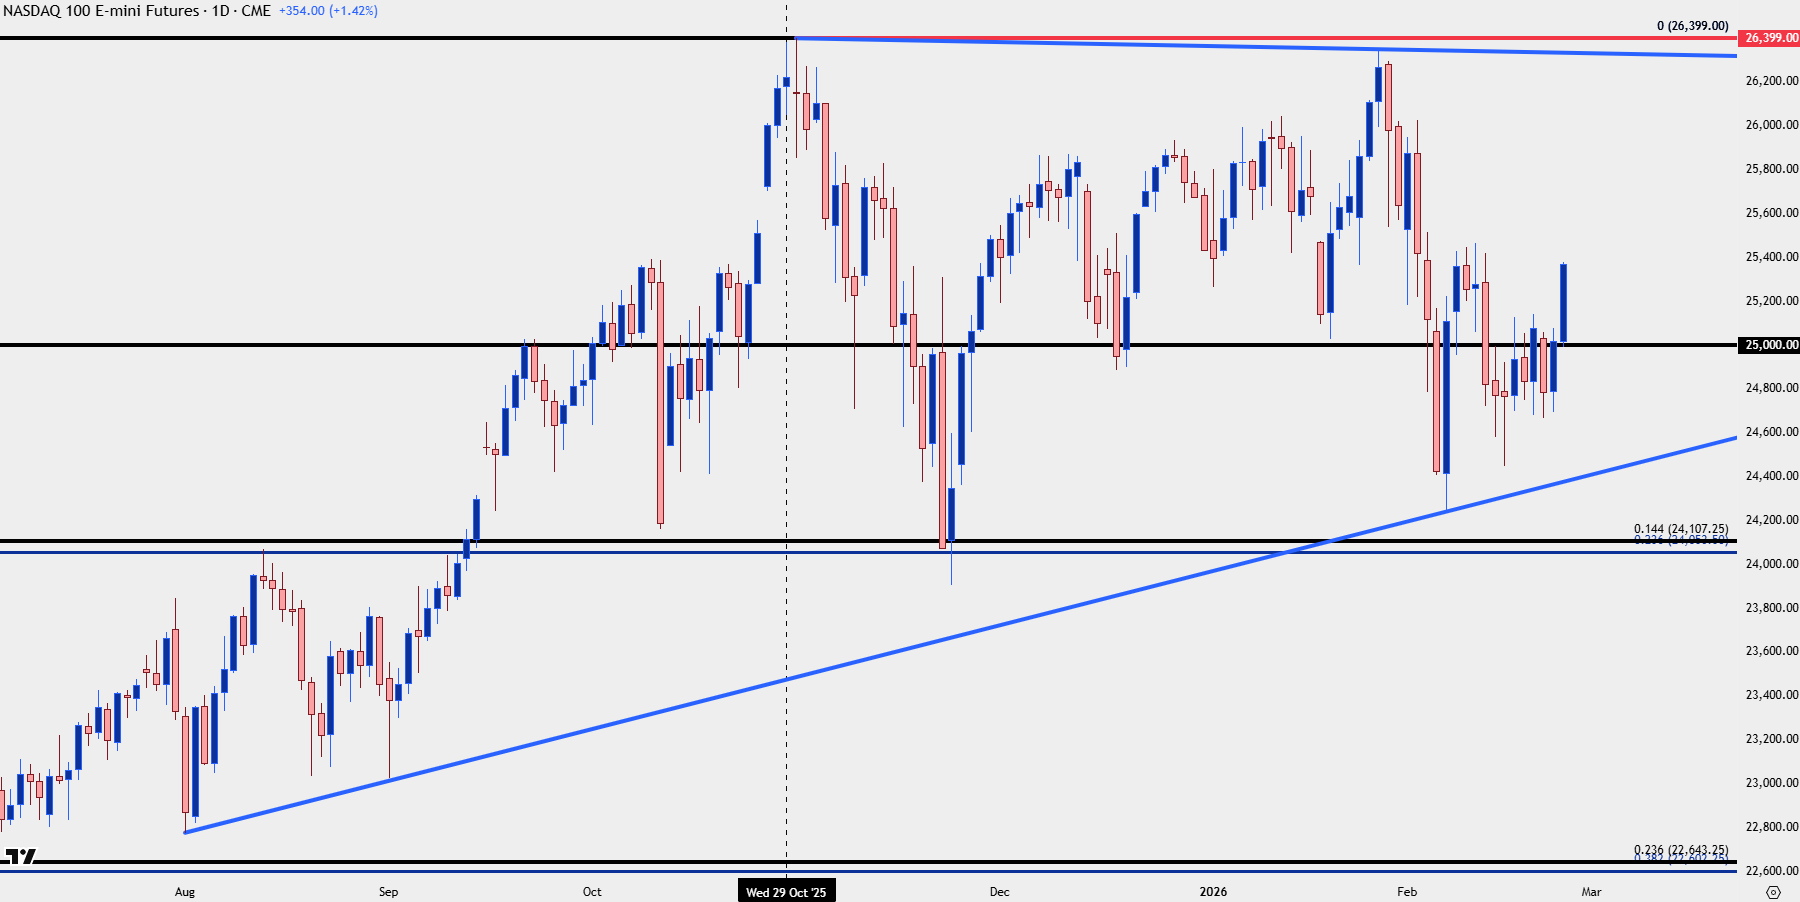
Chart prepared by James Stanley; data derived from Tradingview
Importance of NVDIA
NVDIA is very much the driving force behind the AI trade an in-turn can have an impact on stocks across the space, so it is a bellwether of sorts for both AI and the broader stock market. And Jensen Huang has a history of not disappointing shareholders often using these quarterly earnings announcements to tease new products or highlight bullish news. As a matter of fact, the rally that we’re seeing today can very much be driven in anticipation of that.
But, perhaps the more interesting scenario is what happens in the event of a negative reaction to that?
As noted above it’s still too early to call this doom and gloom for bearish reversal scenarios and there’s a few different support levels in-place for the Nasdaq 100, each of which carries some attraction as we go into the earnings report later today.
The 25k level is obvious, as this is a price that’s been in-play in multiple ways since September as both resistance and support. But, below that, there was a group of swing lows around the 24,600 area which I’m looking at as an ‘s2’ spot of support. And then below that we have what I’m considering as invalidation around the 24,100 area, which was resistance in August and support in October and November.
If bulls fail to hold prices above that zone then we can begin to entertain broader bearish scenarios but, until then, there’s a case to be made on the bullish side of the index.
Nasdaq 100 Daily Chart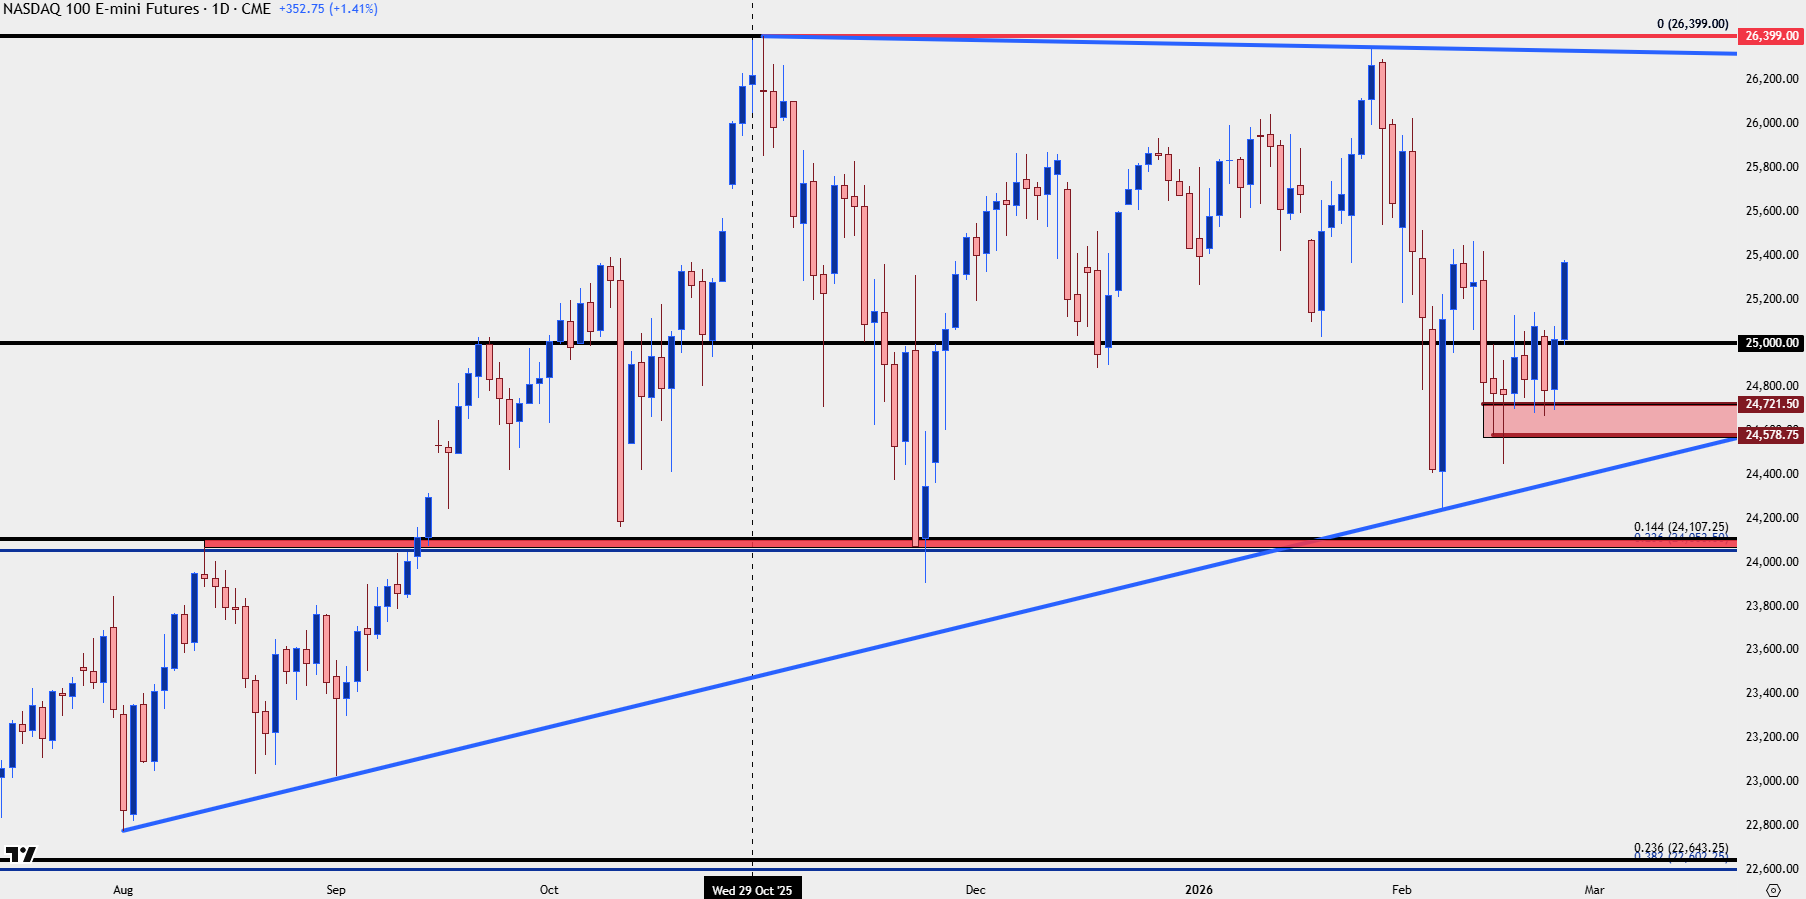
Chart prepared by James Stanley; data derived from Tradingview
--- written by James Stanley, Senior Market Analyst, Global Macro