


The Nasdaq 100 is beginning to lag behind the Dow Jones, reflecting a clear rotation from growth into value and defensives. Semiconductor momentum is cooling, Apple continues to attract dip-buyers, and Meta has fallen sharply into oversold territory. Together, these moves suggest a shifting market dynamic that could define the Nasdaq’s next leg — whether it’s a pause before new highs or the start of a broader pullback.
View related analysis:
- Dow Jones: Pressure Builds for a Topside Break
- S&P 500 Forecast: SPX falls after weak jobs data, AI valuation worries return
- ASX 200 Evening Wrap: CBA Drags Index Lower as Financials Buckle
- ASX 200 Morning Outlook: Bulls Regain Control With Broad Sector Rebound
Nasdaq 100 Ratio Analysis
The rise of semiconductor stocks such as Nvidia, AMD, Broadcom and TSMC has been a key driver behind the Nasdaq’s AI-fuelled rally. Valuations for these companies have arguably been stretched for some time, but we now appear to be at the stage where hardware revenue growth is already more than priced in.
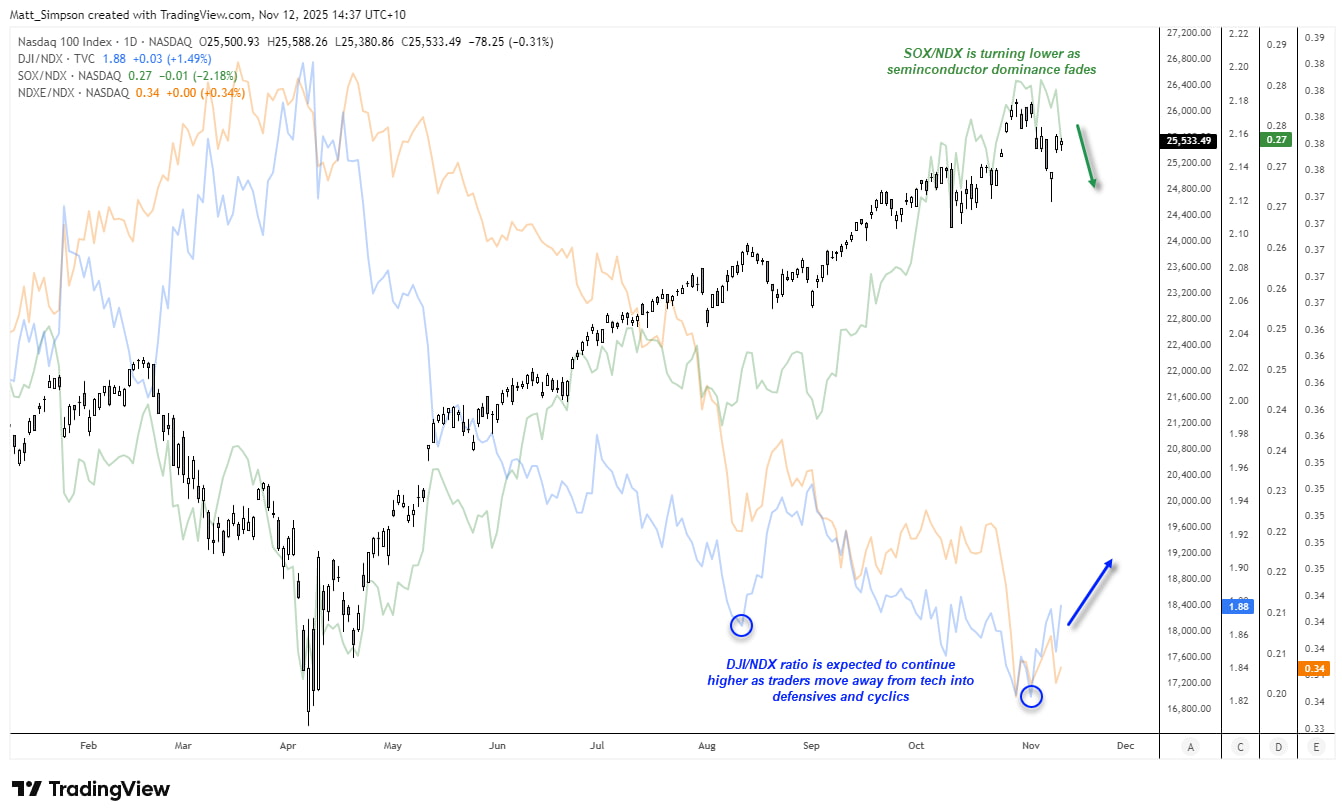
Chart analysis by Matt Simpson - data source: TradingView
It’s therefore notable that the Philadelphia Semiconductor Index (SOX) to Nasdaq ratio has turned lower alongside the Nasdaq itself. That makes sense — the tech sector’s main growth engine is starting to sputter. Should this ratio continue to weaken, the Nasdaq is likely to underperform if Wall Street indices keep rising, or lead the downside in a correction.
The Nasdaq 100 Equal-Weighted Index (NDXE) to Nasdaq ratio (NDXE/NDX) also continues to trend lower, underscoring that the recent Nasdaq advance has been powered by only a handful of heavyweights — not the hallmark of a robust bull market.
Meanwhile, the Dow Jones / Nasdaq ratio (DJI/NDX) is turning higher from historically low levels. This signals rotation out of the tech sector and into value, defensives and cyclicals, marking a broader reallocation away from high-growth names.
It’s also worth noting that the Dow Jones is on the verge of a bullish breakout. The Nasdaq may gain a temporary tailwind from that, but it’s more likely to lag behind — suggesting the DJI/NDX ratio will continue to climb.

Nasdaq 100 Correlations
The positive correlation between the S&P 500 and Nasdaq 100 remains strong across the 10-, 20- and 60-day periods, reflecting broad market alignment. However, the relationship with the Dow Jones has weakened on the shorter time frames, suggesting a gradual rotation of capital away from tech and into more value-oriented sectors.
Meanwhile, the Philadelphia Semiconductor Index (SOX) shows a sharp rebound in correlation with the Nasdaq — now at 0.91 over the past 10 days — confirming that semiconductor performance still heavily influences overall Nasdaq direction.
Apple (AAPL), by contrast, continues to move independently, with a notably weak correlation of 0.35 (10-day) and 0.26 (20-day), highlighting a more idiosyncratic price pattern versus the broader tech complex.
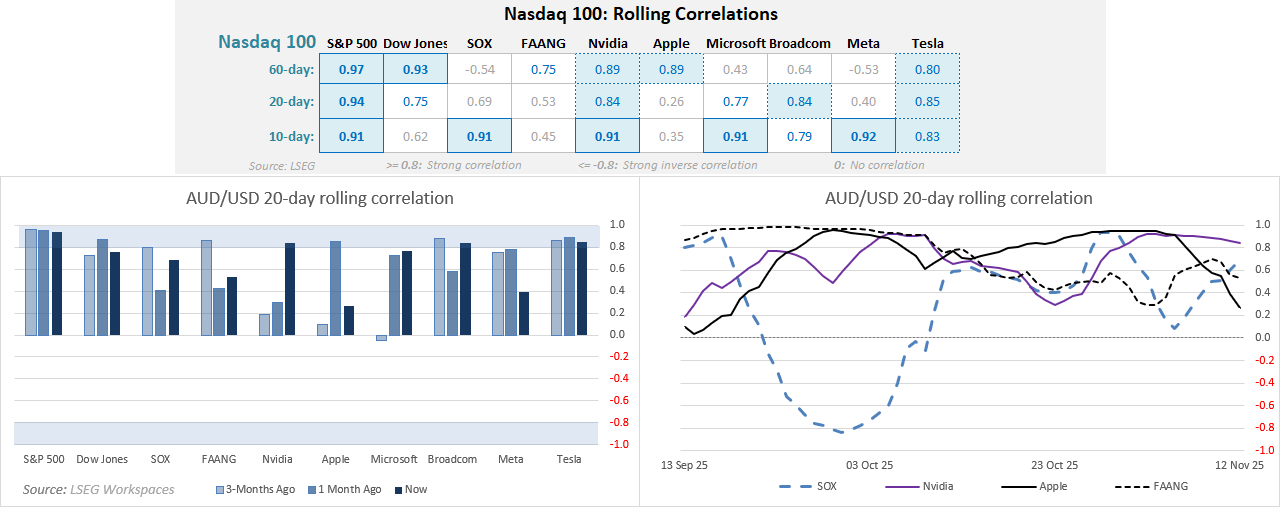
Chart analysis by Matt Simpson - data source: LSEG, NYSE
Nvidia (NVDA) Technical Analysis
We can’t look at the Nasdaq without factoring in Nvidia. A bearish outside week formed last week just below its record high, marking the most volatile week since April’s low. A bearish divergence has also emerged on the weekly RSI (14), warning of potential weakness in the prevailing uptrend. I’m therefore sceptical of the current bounce and suspect that bears may look to fade rallies within last week’s range.
On the daily chart, prices have retraced from the $200 level, though Tuesday’s lower wick suggests that bearish momentum is waning. Buyers may attempt to defend retracements toward gap support near $188.15 for another push higher. For now, the bias is for the rally to stall below $210 and retest the $180 handle near the $177.76 high-volume node (HVN) — with a break beneath that level bringing the $164 lows into focus.
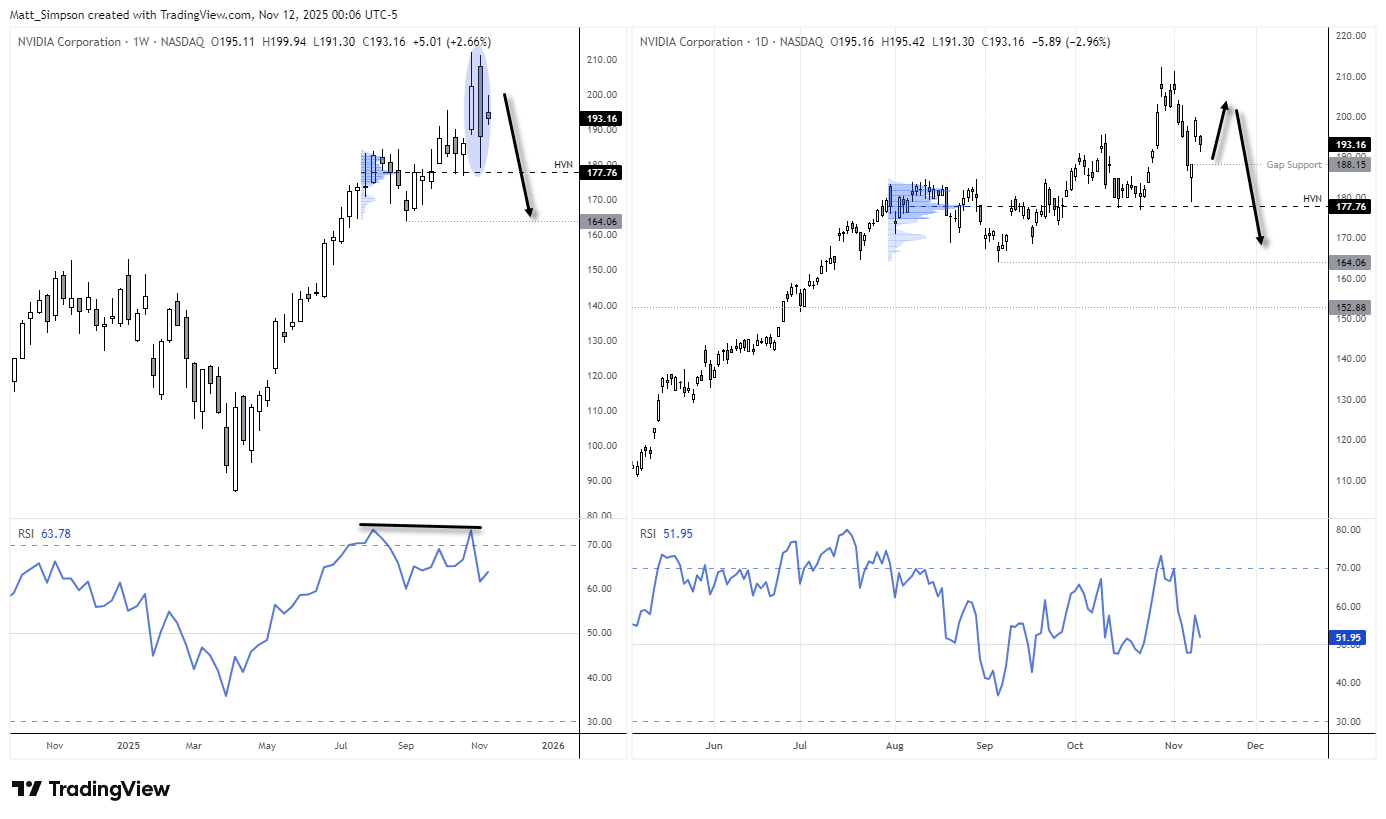
Chart analysis by Matt Simpson - data source: TradingView

Apple (AAPL) Technical Analysis
Apple’s (AAPL) daily chart displays a clean, bullish trend structure, with well-timed swing lows forming around the 10-day EMA. Price action now sits on the verge of a potential breakout to new highs, supported by strong trend alignment across moving averages.
Interestingly, Apple’s decision to scale back AI-related spending appears to be paying off, especially as the market grows wary of excessive AI investment by peers such as Nvidia and Microsoft. As a result, Apple remains firmly on my bullish Nasdaq watchlist, even amid broader concerns of an AI-driven bubble.
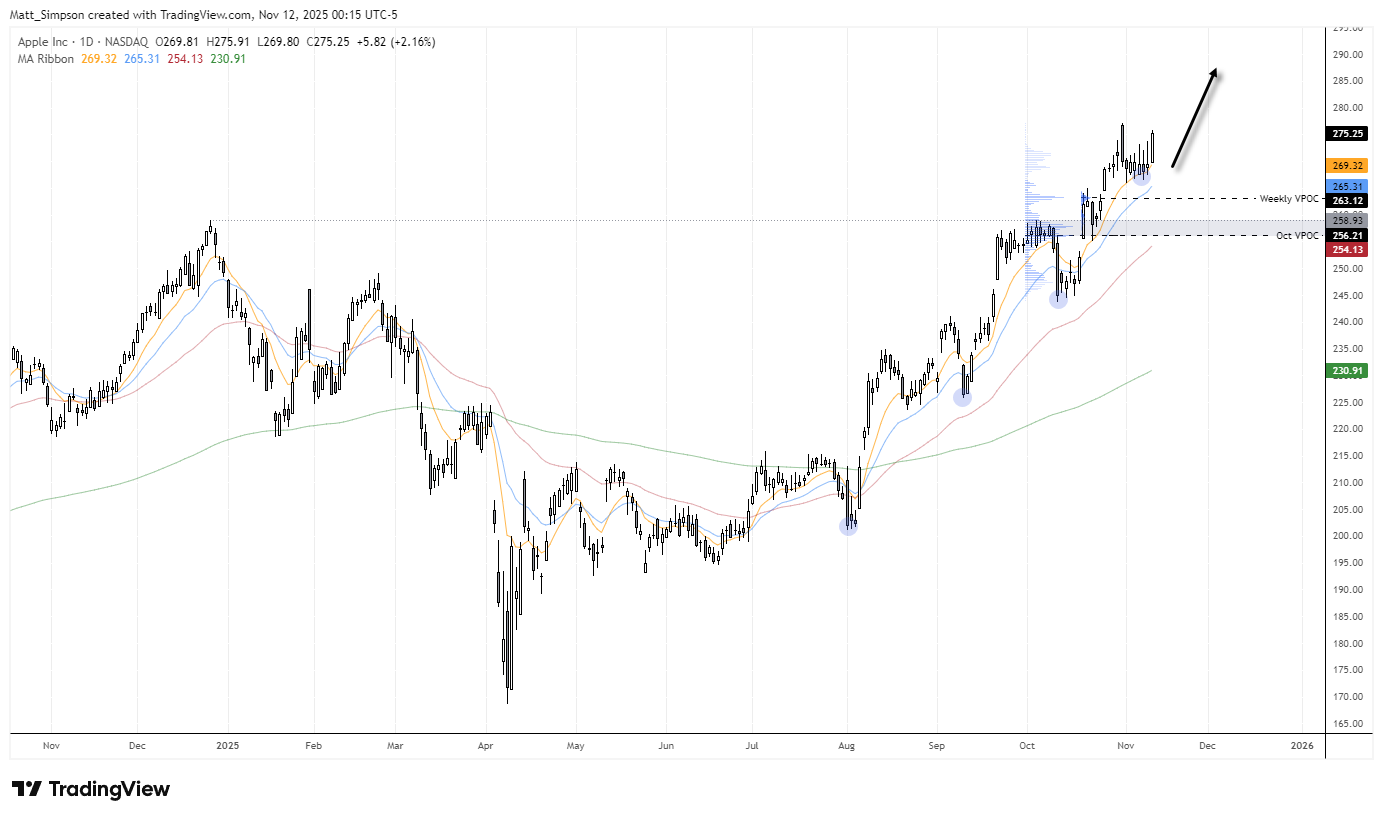
Chart analysis by Matt Simpson - data source: TradingView
Meta (META) Technical Analysis
From a purely technical standpoint, Meta appears oversold in the near term. The stock has fallen 24.5% from its August high, with 20% of that decline occurring in the past week — half of which came from a single large gap lower.
However, bearish momentum is clearly easing. The daily RSI (2) plunged to an extremely oversold level of 1 last week, just before a bullish hammer formed near gap support, the $600 handle, and a high-volume node (HVN). Price has since managed a modest rebound, and the bias remains constructive while prices hold above last week’s low, with scope for a retest of the 200-day EMA near $676.37.
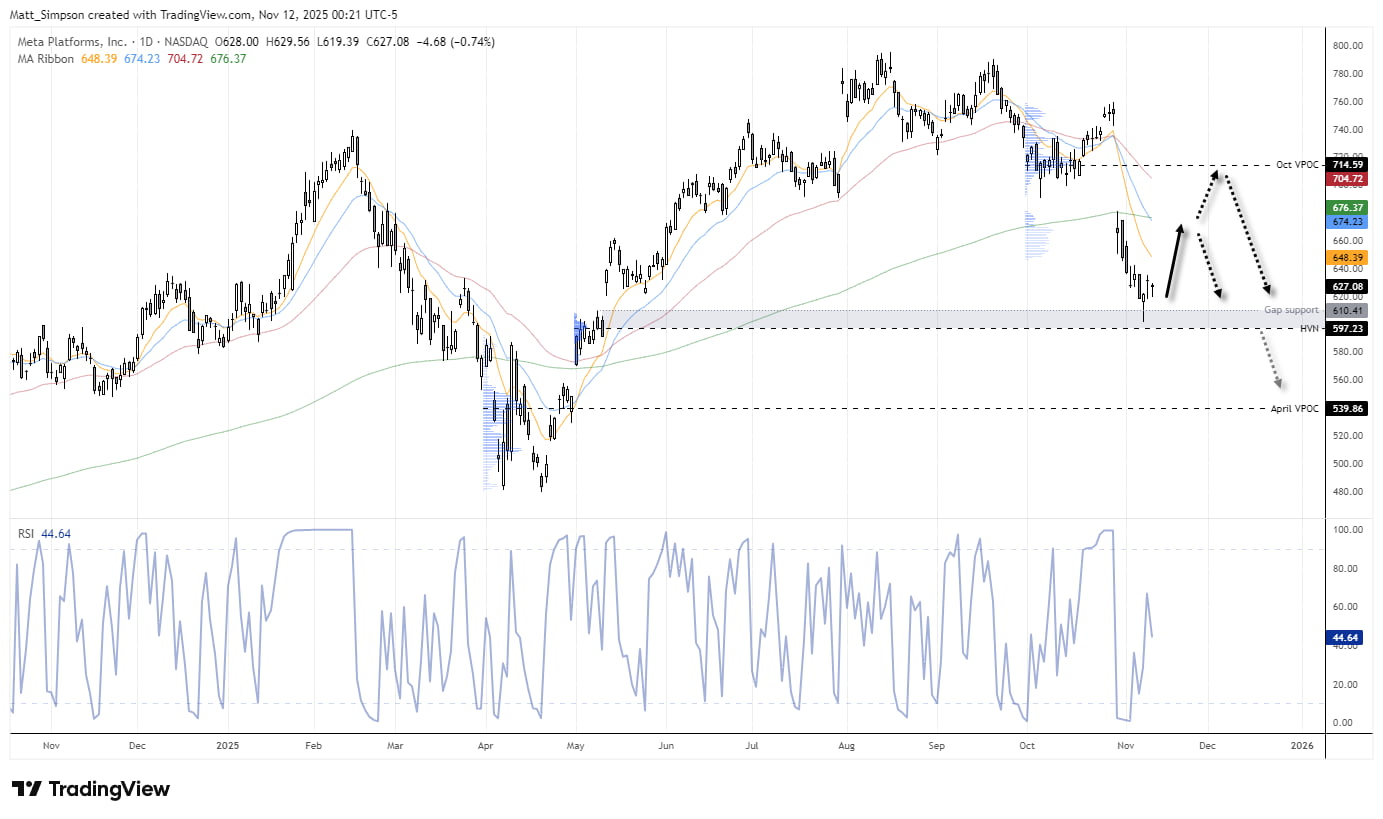
Chart analysis by Matt Simpson - data source: TradingView
View the full economic calendar
-- Written by Matt Simpson
Follow Matt on Twitter @cLeverEdge
How to trade with City Index
You can trade with City Index by following these four easy steps:
- Open an account, or log in if you’re already a customer
• Open an account in the UK
• Open an account in Australia
• Open an account in Singapore
- Search for the market you want to trade in our award-winning platform
- Choose your position and size, and your stop and limit levels
- Place the trade


