Wall Street staged a sharp reversal to start the week, with the Nasdaq 100 leading a broad risk-on rebound as geopolitical tensions eased. With bearish momentum fading, attention now turns to whether the ASX 200 and Nikkei can follow through higher in today’s session.
View related analysis:
- FX Futures Positioning: USD, EUR, CHF, AUD, CAD | COT report
- Australian Dollar Outlook: Strait of Hormuz Risk Clouds AUD/USD Rally
- Nasdaq 100: Bull Trend Ready to Resume? GOOG, MSFT, RKLB Signal Rebound
- ASX 200 Market Outlook: Grinds Higher, but Momentum Still Fragile
Wall Street Rebound Led by Nasdaq 100 as ASX 200 and Nikkei Eye Gains
It was another volatile start to the week on Monday, though one that ended decisively risk-on this time around. President Trump’s latest TACO trade swung into action before the US open after he backed down from his threat to attack Iran’s oil infrastructure.
- Crude oil prices plunged over 14% in a matter of minutes upon the first real signs that the US had blinked.
- Wall Street indices quickly erased Friday’s losses with their bullish engulfing daily ranges sitting around 4%
- Gold recouped most of the day’s losses after initially plunging around 10% and rebounding from just above 4100
- Silver recovered back above Monday’s open though met resistance below $70 to mark its ninth daily decline from the prior close – its worst such run since April 2022

Wall Street Indices Stabilise as Selling Pressure Eases Amid Iran Conflict
Wall Street indices had already fallen around 5% since the Friday prior to the escalation of the Iran conflict, although they were in a broader selling phase regardless. The Nasdaq has led declines overall, falling -11.5% from its record high, while the S&P 500 is down -8.6% and the Dow Jones -10.7%.
With no guarantee that Trump can end the conflict as quickly as it began, further downside risks remain for US equities, particularly as the war appears to account for roughly half of the current drawdown.
However, bearish momentum has clearly eased for now. All three indices are holding above key support levels and have printed bullish engulfing sessions with gains of around 4%, suggesting a near-term stabilisation.
And that could see a bullish follow-through in Asia today.
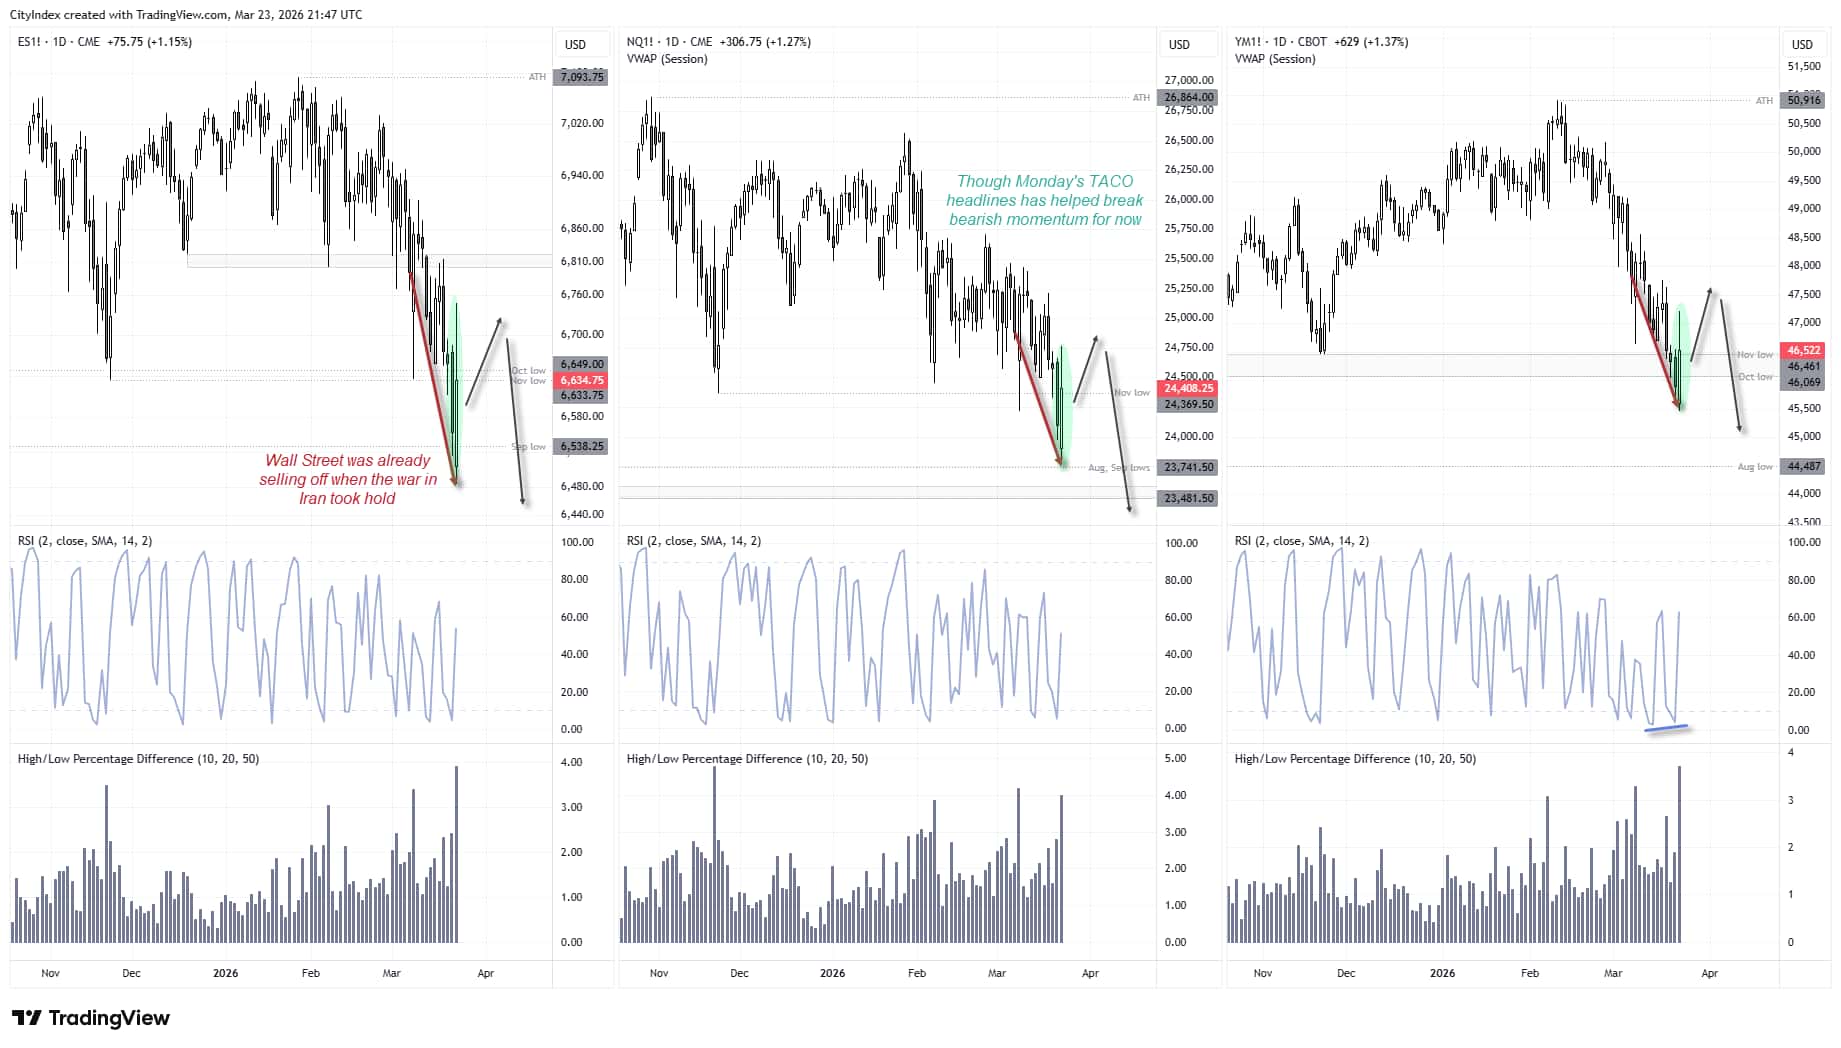
Source: CME, CBOT, TradingView
ASX 200 Technical Analysis
Monday’s options positioning shows the prior session’s low held above a major call cluster at 8250, with both the daily RSI (14) and RSI (2) in oversold territory. The cash market formed a bullish hammer with a long lower wick, while SPI 200 futures (right) show a strong rebound on the 4-hour chart—suggesting the cash market will gap higher on the open.
ASX futures met resistance around the month-to-date volume point of control (MTD VPOC) and monthly pivot point. A minor pullback could allow bulls to re-enter for a potential move higher. A break above 8722 exposes a run towards the 8800 handle, just below the 200-bar SMA, monthly R2 pivot, and the 8843 swing high.
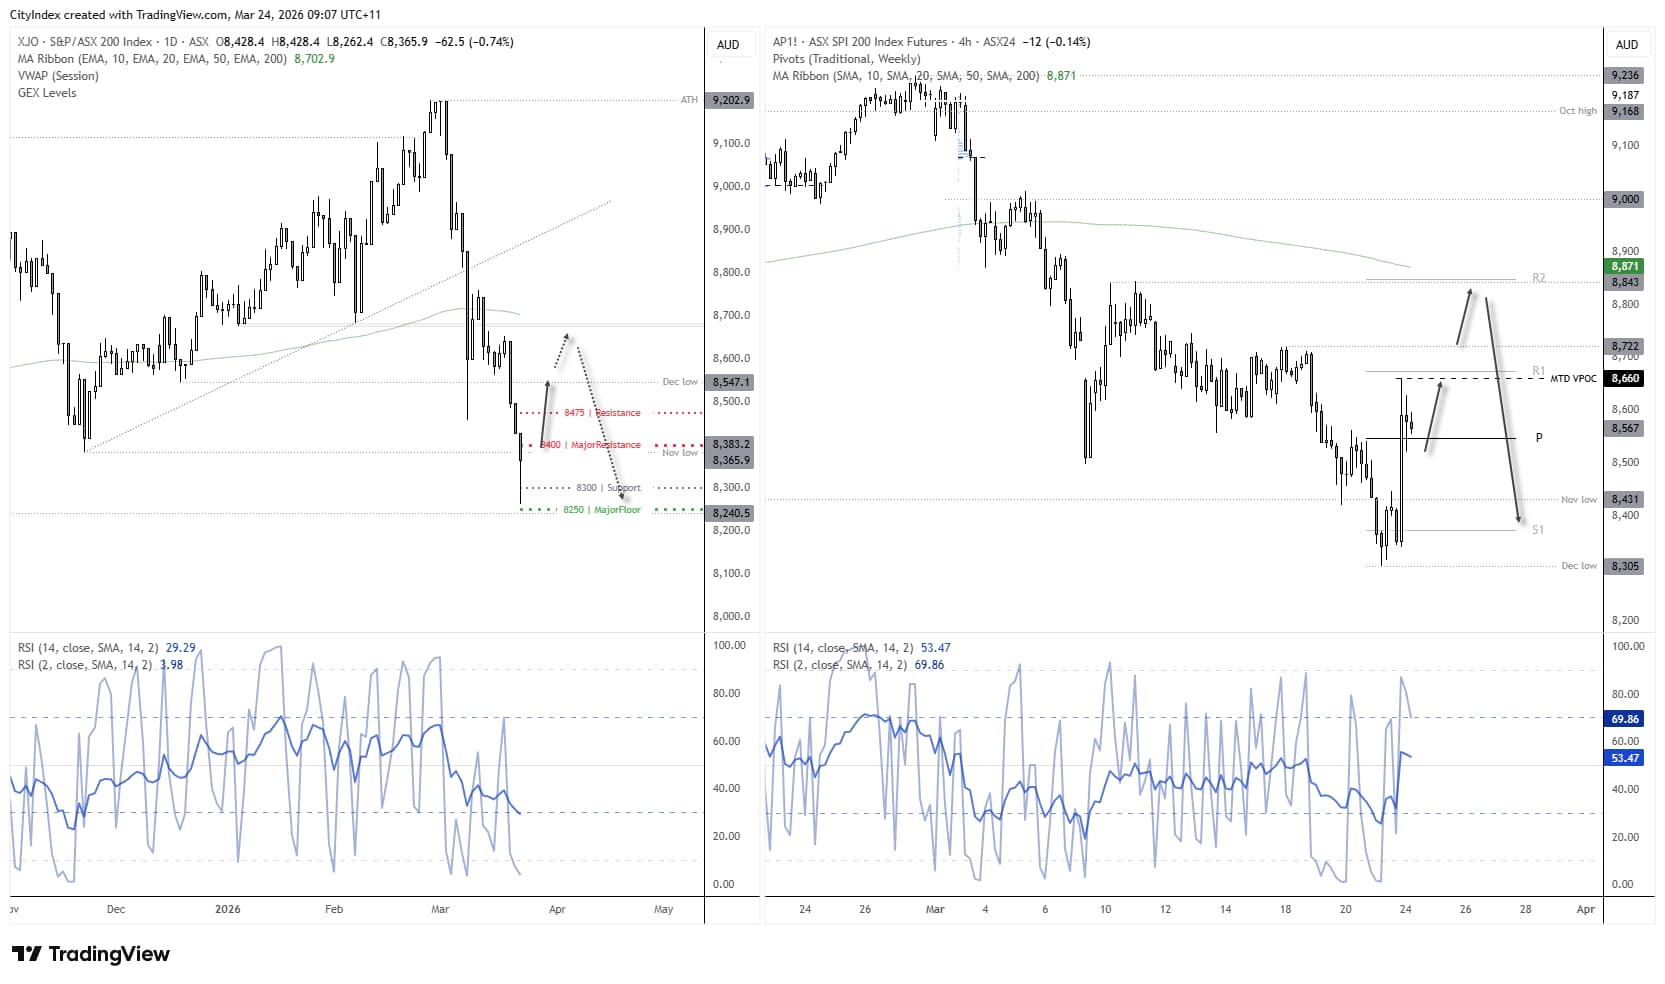
Source: ASX, ASX24, TradingView
Nikkei 225 Futures (NK) Technical Analysis
Nikkei futures have staged a decent rebound from the December VPOC, although the selloff from the record high is not yet out of the woods. Price action suggests only one impulsive leg lower has formed, raising the risk that any bounce here is a ‘wave B’ within a broader ABC correction.
That leaves scope for another leg lower towards ~49k, where the 200-day EMA, January low and 38.2% Fibonacci retracement converge.
Near-term momentum is pointing higher, so bulls may attempt a push towards 55k. However, while prices remain capped below 56k, the broader structure favours another leg lower towards 49k.
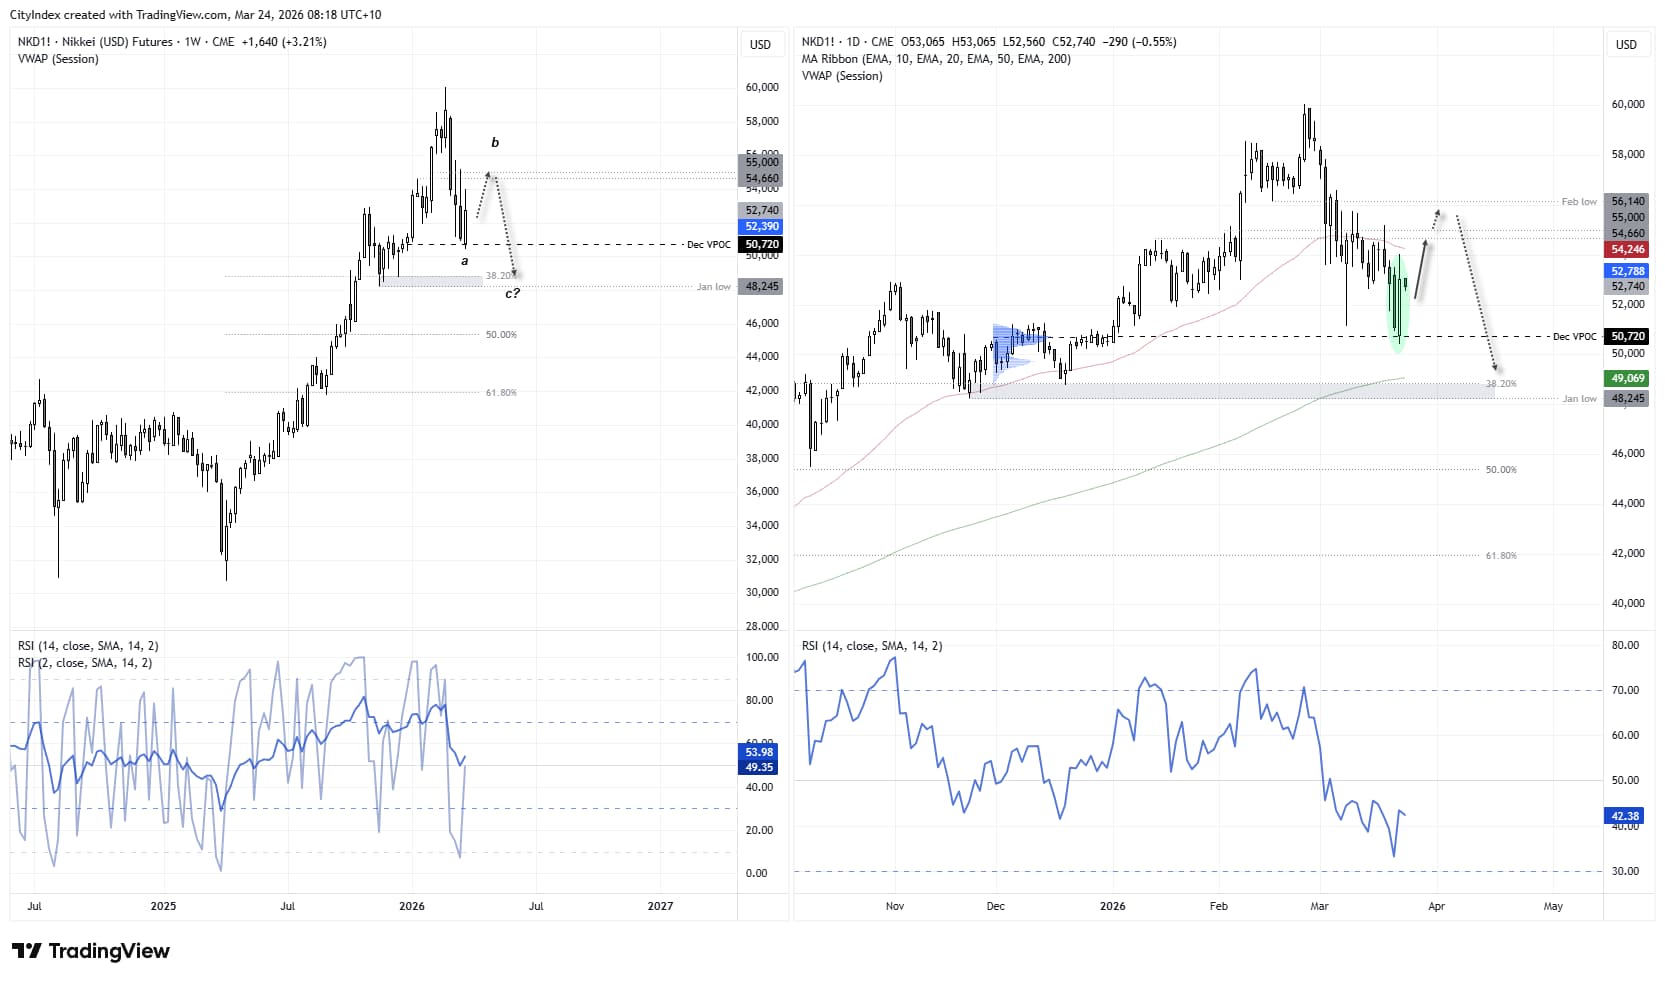
Source: CME, TradingView
View the full economic calendar
-- Written by Matt Simpson
Follow Matt on Twitter @cLeverEdge
How to trade with City Index
You can trade with City Index by following these four easy steps:
- Open an account, or log in if you’re already a customer
• Open an account in the UK
• Open an account in Australia
• Open an account in Singapore
- Search for the market you want to trade in our award-winning platform
- Choose your position and size, and your stop and limit levels
- Place the trade