


Strong Big Tech earnings have kept the Nasdaq 100 supported into early February, with upbeat results from Microsoft, Meta and Apple underpinning sentiment. That strength also helped the Bloomberg FAANG 2 Index print a fresh record high, reinforcing the AI-led growth narrative driving US tech.
However, beneath the surface, signals are becoming more mixed. Correlations within the Nasdaq 100 are weakening, February seasonality has historically skewed negative, futures positioning remains elevated but not extreme, and price action is increasingly range-bound below record highs. Together, these factors suggest upside momentum may be slowing, even as fundamentals remain broadly supportive.
View related analysis:
- Trade to Watch 2026: Nasdaq 100 Correction Risk Before New Highs
- ASX 200 Market Outlook: XJO Slides as RBA Looms, Bearish Signals Build
- FX Futures Positioning: USD Index, AUD/USD, USD/CAD | COT report
- Australian Dollar Outlook: AUD/USD Mulls Pullback Despite RBA Hike Bets
Nasdaq 100 Faces Resistance as Earnings Momentum Slows
Fundamentals across tech earnings were broadly strong — beats, solid growth and continued momentum in cloud and AI. That helped push the Bloomberg FAANG 2 Index to a fresh record high on Thursday. However, the week closed with a clear shooting-star candle at the highs, warning of near-term trend exhaustion after an extended rally.
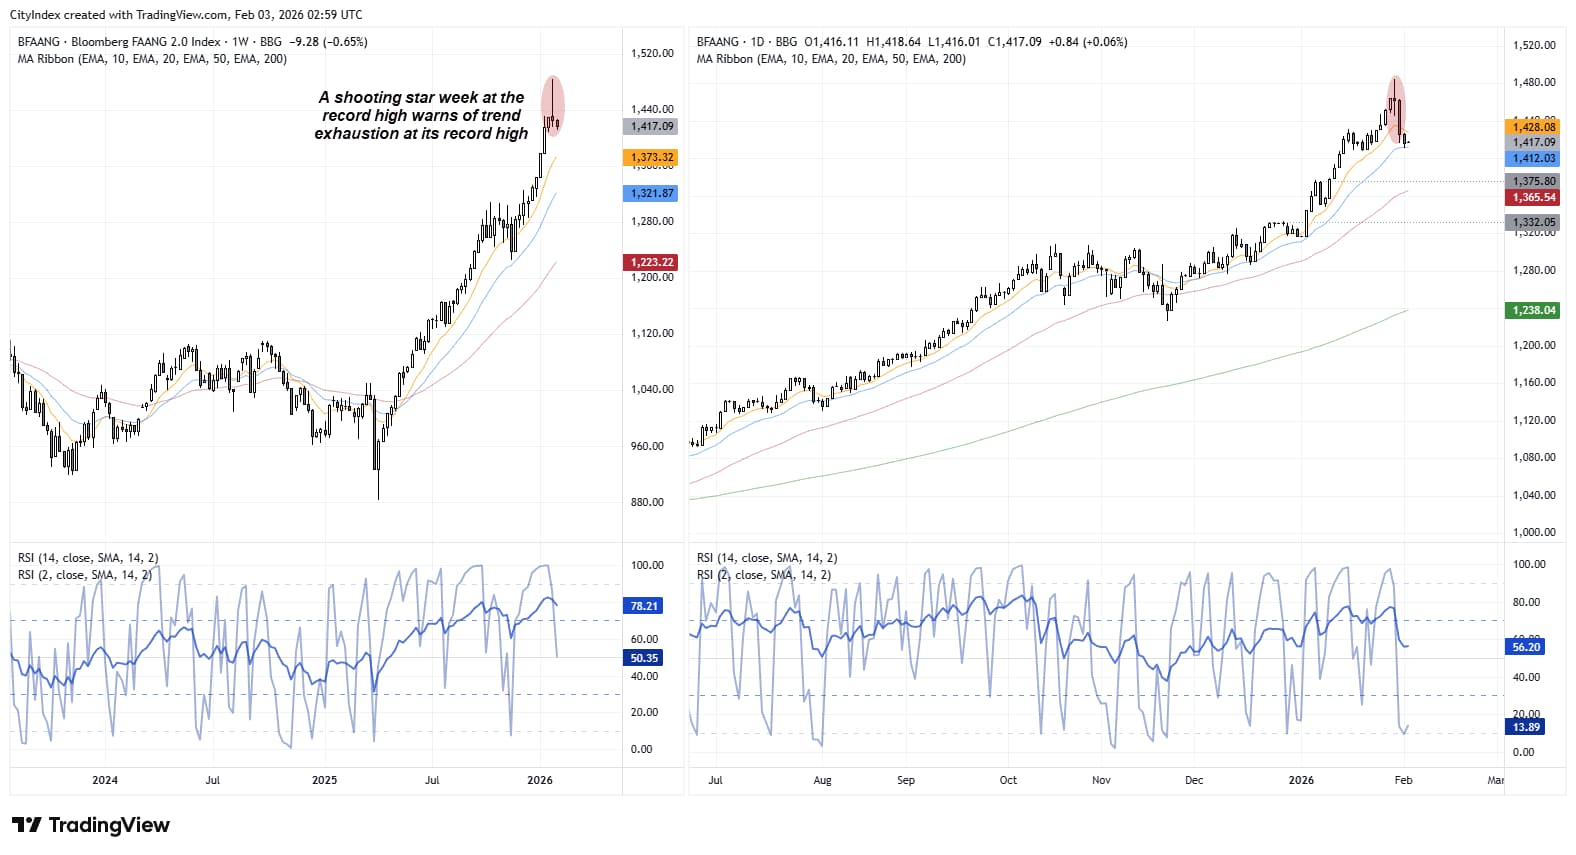
Source: TradingView
- Microsoft delivered a clear beat on revenue and EPS, with sales up around 17% and cloud growth remaining strong. However, the stock slipped as investors focused on rising AI capex and concerns that cloud margins could come under pressure.
- Meta also beat on both revenue and earnings, with management leaning heavily into AI as a driver of future growth. Unlike Microsoft, the market rewarded that message, sending shares higher.
- Apple reported record revenue, supported by resilient iPhone demand — particularly at the premium end. Despite the headline strength, the stock reaction was muted as investors remained cautious on the broader tech outlook.
- Tesla posted a modest beat, but earnings declined year-on-year. The stock response was mixed, with investors still weighing near-term EV volume pressure against longer-term spending on AI and robotics.

Nasdaq 100 Correlations
Correlation signals have weakened beneath the surface of the Nasdaq 100. Apple and Nvidia have shown little to no meaningful correlation over the past couple of weeks, highlighting increasing dispersion among mega-cap tech leaders.
Correlation has also softened versus the SOX and Dow Jones over the past 10 days, while remaining firmly positive with the S&P 500. In contrast, the FAANG index continues to show a relatively strong relationship with the Nasdaq 100, with correlations around 0.7 across both the 10- and 20-day windows.
Overall, the data point to rising internal divergence within tech rather than a broad, unified sector move.
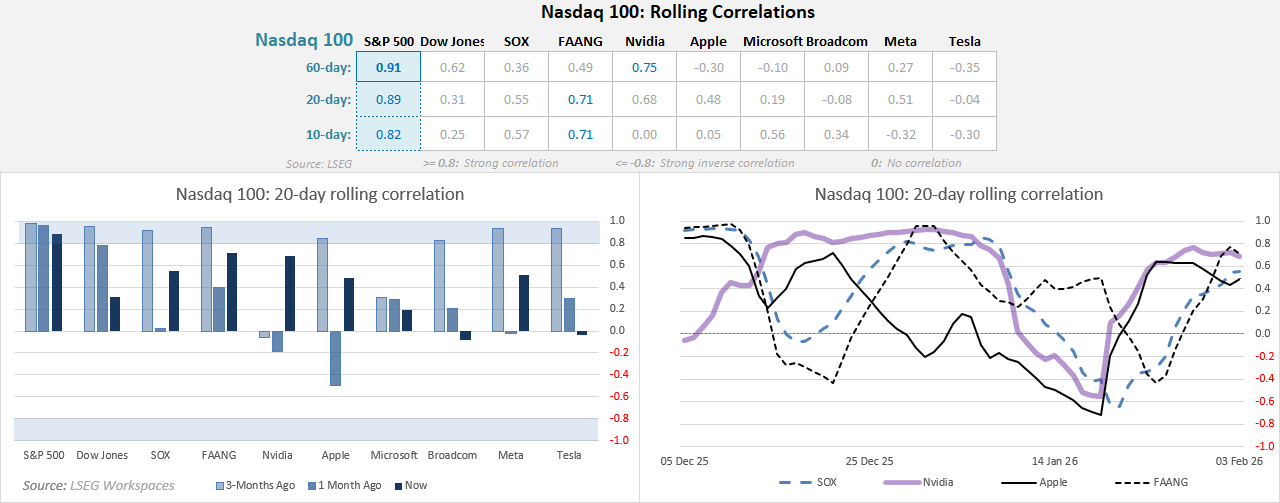
Source: NASDAQ, LSEG
Nasdaq 100 Seasonality for February
Using cash market data over the past 25 years, February stands out as one of only two months that tend to deliver negative average and median returns, alongside a sub-50% win rate.
While the average return is -1.2%, the median (typical) return is a milder -0.5%, highlighting that losses are often driven by a handful of outsized drawdowns rather than consistent weakness. Importantly, when February closes lower, the average decline is -5.0%, which is materially larger than the average gain of 4.1% during positive Februarys. This skew helps explain the month’s poor long-term profile despite not always being persistently weak.
- Average return: -1.2%
- Median return: -0.5%
- Average positive month: 4.1%
- Average negative month: -5%
- Win rate: 41.7%
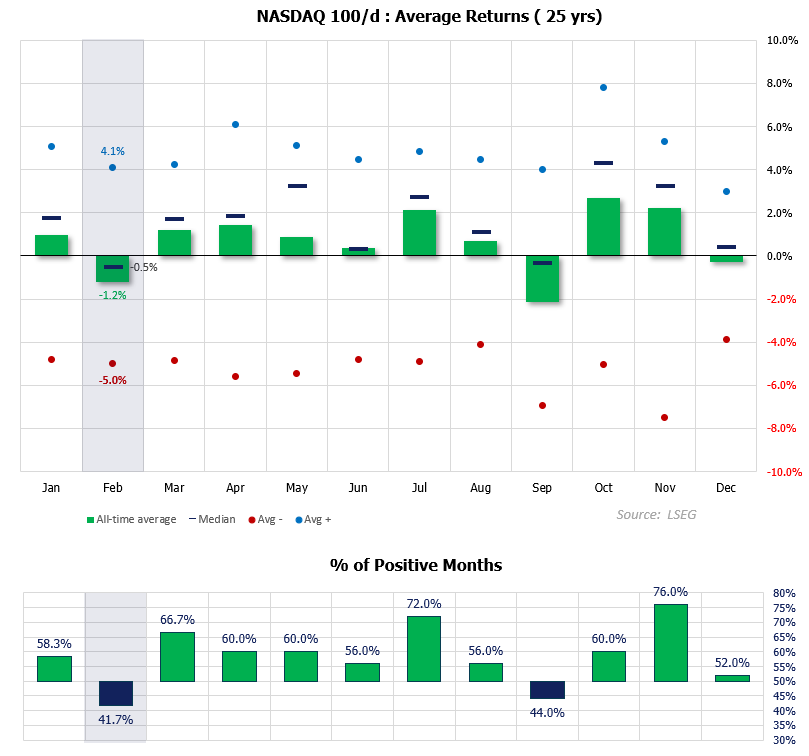
Source: NASDAQ, LSEG
Nasdaq 100 futures (NQ) positioning – COT report:
Asset managers have remained net-long Nasdaq 100 futures since October 2022, with only a brief three-week net-short stint during that period. Bullish exposure increased notably between April and August and has since stabilised within a 72–85k contract range.
What has changed more recently is a modest reduction in both long and short positions, pointing to slightly lower speculative participation rather than a shift in conviction. Overall, there are no imminent signs of a bullish sentiment extreme, nor evidence of panic from bears. Positioning remains supportive, but not crowded.
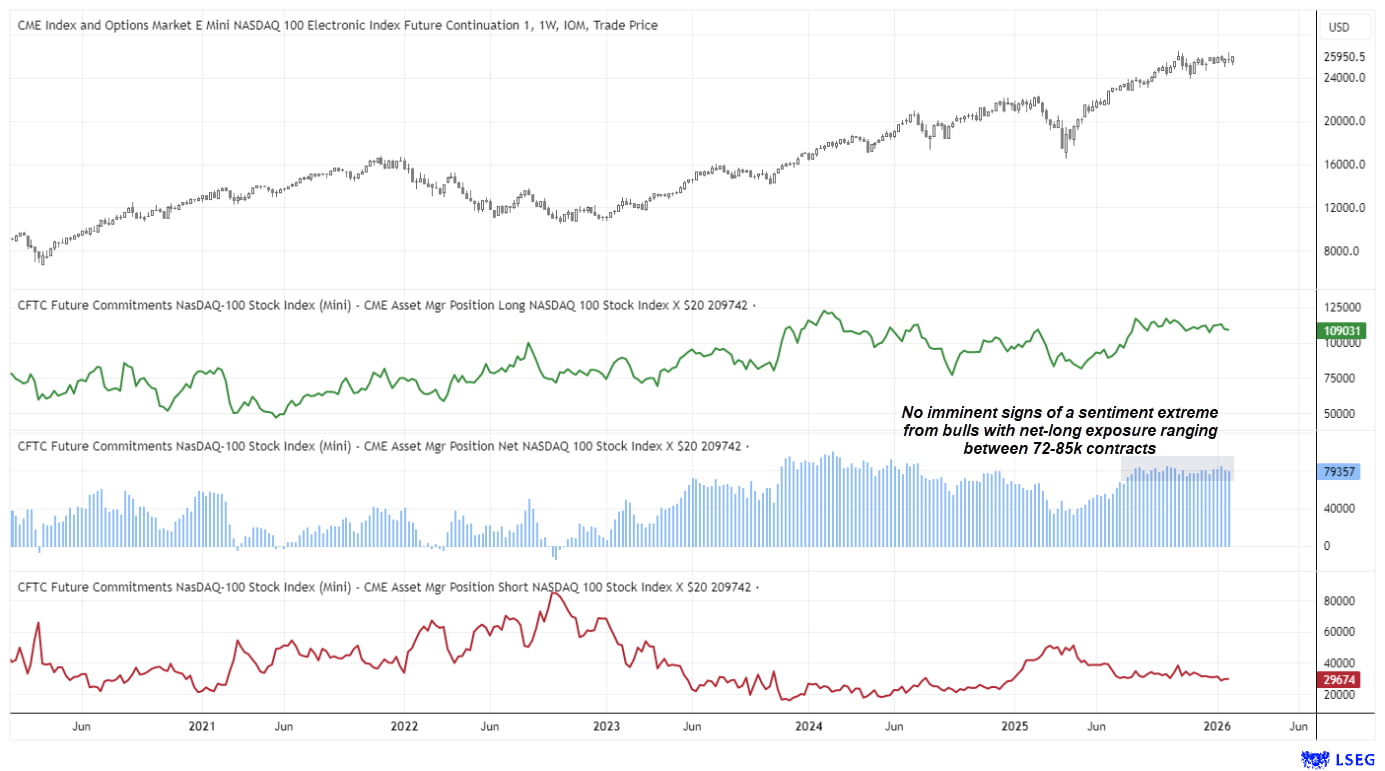
Source: CFTC, CME, LSEG
Nasdaq 100 Futures (NQ) Technical Analysis
We’re yet to see the corrective phase I had anticipated for the quarter, largely because earnings have surprised to the upside and sentiment remains resilient. That has kept the Nasdaq 100 above its 20-week EMA. However, price action remains choppy, and downside risk persists while the index trades below its record high.
The week began with a solid bullish candle on Monday, highlighting strong demand around the 25,200 area. Bulls may look to buy dips within Monday’s range for a push back toward last week’s highs. That said, my near-term bias favours further consolidation, with prices recycling lower within the range while capped beneath the 26,349 high.
Until a clear catalyst emerges, range-trading conditions remain dominant. Traders may look to fade moves between 25,000 and 26,350. A decisive break below 24,887 would suggest the deeper pullback flagged late last year is finally underway.
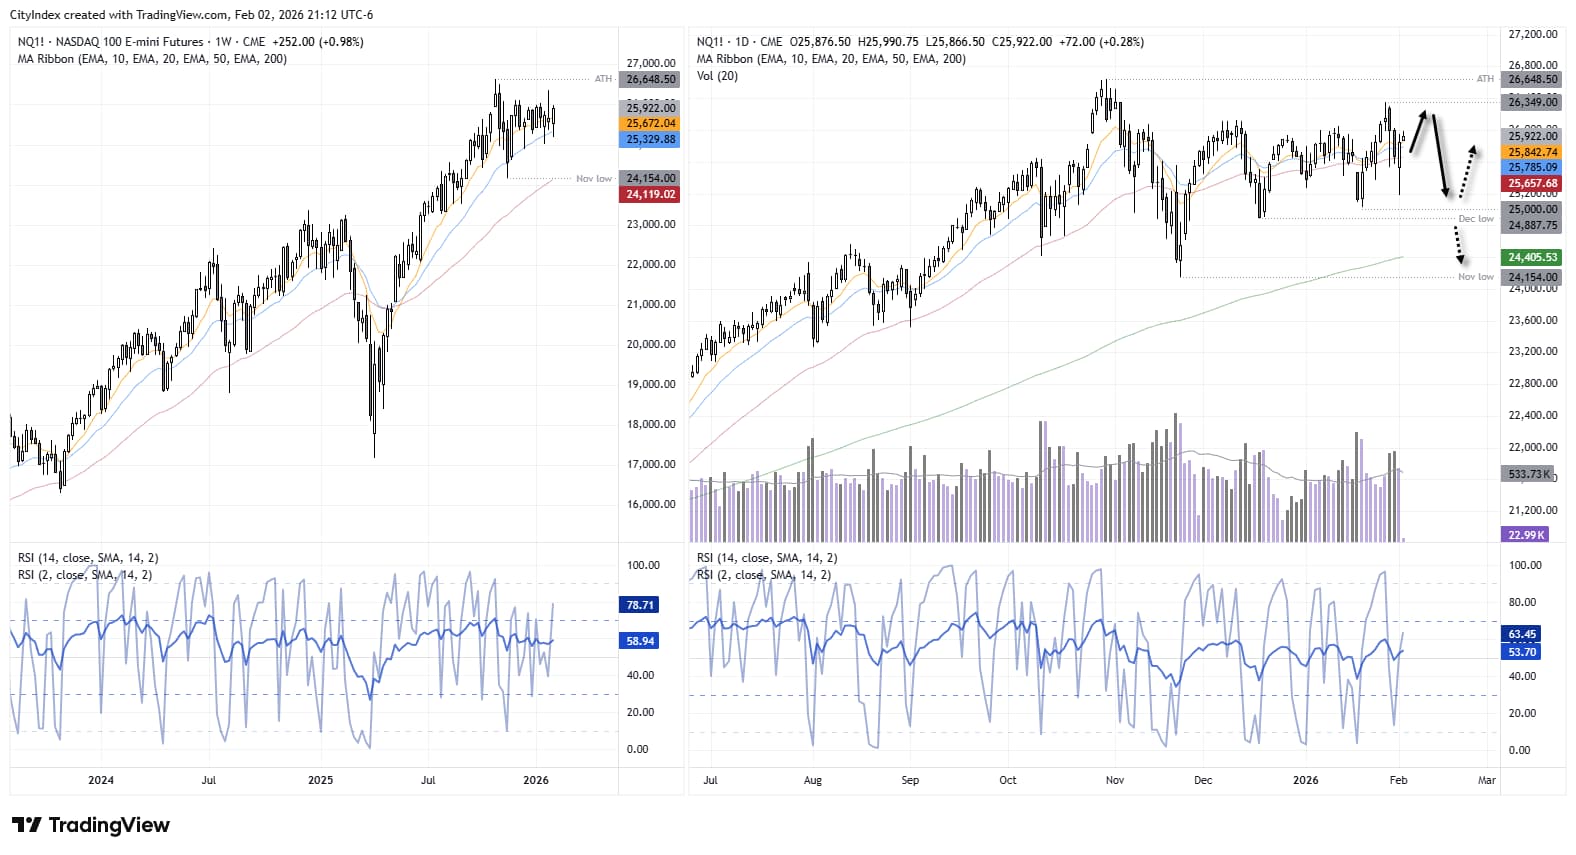
![]()
Source: CME, TradingView
View the full economic calendar
-- Written by Matt Simpson
Follow Matt on Twitter @cLeverEdge
How to trade with City Index
You can trade with City Index by following these four easy steps:
- Open an account, or log in if you’re already a customer
• Open an account in the UK
• Open an account in Australia
• Open an account in Singapore
- Search for the market you want to trade in our award-winning platform
- Choose your position and size, and your stop and limit levels
- Place the trade


