
To understand how the Nasdaq 100 typically trades around Thanksgiving, I analysed daily returns for the three sessions leading into the holiday and the three that follow. With US markets closed on the Thursday, this covers Monday to Wednesday beforehand, and Friday through Tuesday afterwards. The aim is to identify which days show repeatable tendencies in direction, volatility and win rate — and which offer little in the way of a reliable seasonal edge.
View related analysis:
- Nasdaq Leads Wall Street Lower: Tesla Turns, Apple Sours
- ASX 200 Market Outlook: Risk-Off Deepens as Volatility Spikes
- Nvidia (NVDA) Earnings Stats for Nasdaq 100 Traders
- Nasdaq 100 Lags Dow Jones: Divergent Signals Among Nvidia, Apple, Meta
Nasdaq 100 Thanksgiving Seasonality Breakdown
Straight off the bat, we can see that the day before Thanksgiving tends to be bullish for the Nasdaq 100. The Wednesday prior shows an average return of 0.37% and a median return of 0.34%, indicating a robust pattern rather than a result skewed by a few outliers.
Wednesday also has a strong win rate of 67.4%, meaning it closes higher roughly two times out of three on Thanksgiving Eve. It has the second-largest bullish daily range, with an average move of 1.16% and a median of 1.28%. The stacked range chart at the bottom also shows that gains are skewed to the upside, making Wednesday the most reliable pattern in the dataset overall.

The Friday after Thanksgiving also has positive average and negative return, though not as prominent as the Tuesday ahead of it. The win rate is 51.1%, though stacked returns are skewed negatively. Also note that it is the least volatile day of the six analysed, likely because traders are taking the long weekend. This makes the data less reliable in my view.
Out of the six days analysed, the Tuesday before Thanksgiving has delivered an average return of –0.2%. However, the median return is slightly positive at 0.05%, indicating that a few deeper declines have pulled the average lower. ‘Stacked’ returns show a positive skey, yet the win rate is also mildly negative at 48.8%. Overall, there’s no consistent pattern on the Tuesday ahead of Thanksgiving.
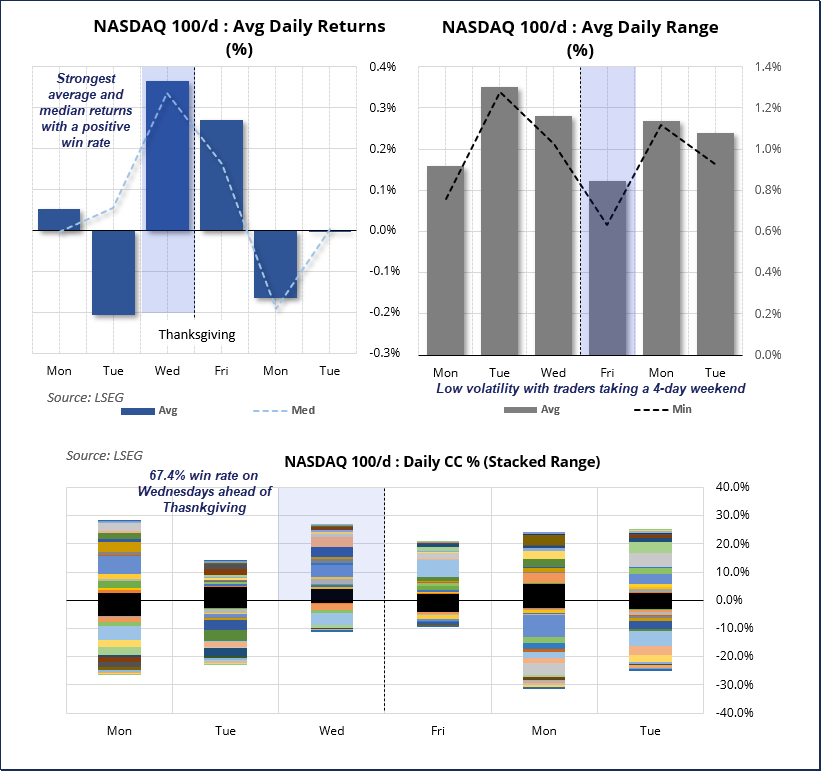
Chart analysis by Matt Simpson - data source: Nasdaq, LSEG
Nasdaq 100: Daily Returns Analysis
With Wednesday (T-1) emerging as the strongest day in the Thanksgiving window, it’s worth examining its historical behaviour across the full sample.
The long-term average daily range sits around 1.2%, yet volatility on the Wednesday before Thanksgiving has only exceeded that level twice in the past 16 years, showing that pre-holiday volatility has been structurally lower since 2008. Even so, the daily range has hovered near 1% over the past three years.
Last year broke the streak, with the Nasdaq 100 closing lower on the Wednesday before Thanksgiving for the first time in eight years. It was also the most bearish T-1 close in 13 Thanksgiving periods. Despite that one-off decline, the broader bullish tendency remains intact and has been relatively robust in recent years.
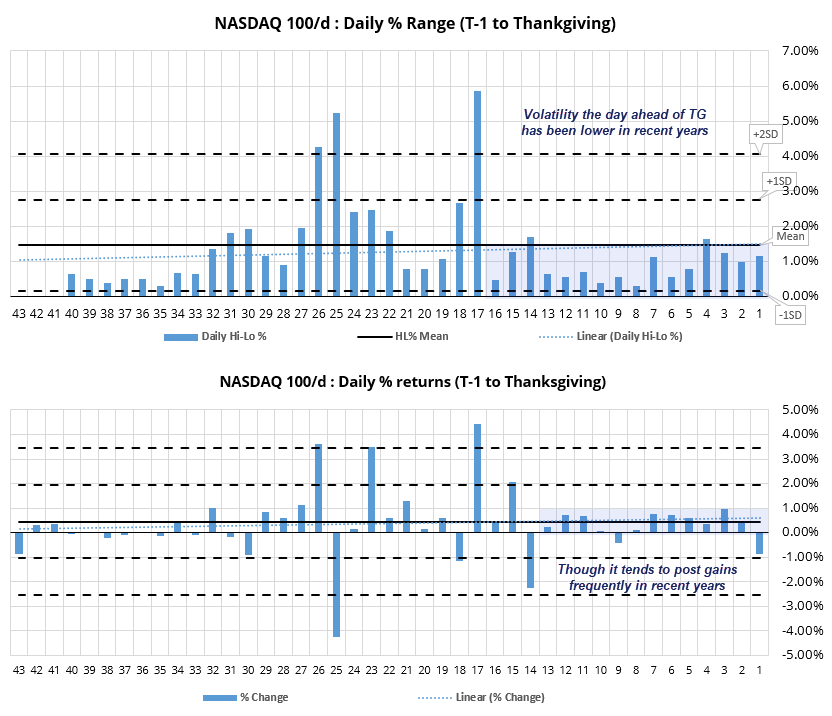
Chart analysis by Matt Simpson - data source: Nasdaq, LSEG

Nasdaq 100 Futures Technical Analysis
The US tech sector fell for a third straight week — its first such run since March. That earlier sequence kicked off a 26% decline from the February high, with the index dropping in seven of the following nine weeks. I don’t expect a repeat of that magnitude this time, and my base case is that any deeper selloff is more likely a 2025 story. Still, the Nasdaq 100 has scope to slip towards the 2024 high (23,114.75) before meaningful support emerges.
The index held around its 20-week EMA into last week’s close, and a small bullish candle formed around the 24,158 high-volume node (HVN). Futures opened with a gap higher on Monday. Given the size of the recent drop and the upcoming four-day weekend, some bears will likely book profits, while seasonality may tempt a few bulls back in — as has often been the case over the past decade.
Into next week, we can reassess whether bears re-load for another leg lower.

Weekly and daily Nasdaq 100 futures charts showing the recent three-week decline, support at the 20-week EMA, a bullish reaction around the 24,158 HVN, and potential downside towards the 2024 high near 23,115. Chart analysis by Matt Simpson — data source: Nasdaq, TradingView.
Chart analysis by Matt Simpson - data source: Nasdaq, TradingView
View the full economic calendar
-- Written by Matt Simpson
Follow Matt on Twitter @cLeverEdge
How to trade with City Index
You can trade with City Index by following these four easy steps:
- Open an account, or log in if you’re already a customer
• Open an account in the UK
• Open an account in Australia
• Open an account in Singapore
- Search for the market you want to trade in our award-winning platform
- Choose your position and size, and your stop and limit levels
- Place the trade